
More Information
Submitted: August 23, 2022 | Approved: September 01, 2022 | Published: September 02, 2022
How to cite this article: Arif A. Effect of COVID-19 on the ambient air pollution in Tunisia during 2020 and 2021 years. J Community Med Health Solut. 2022; 3: 054-059.
DOI: 10.29328/journal.jcmhs.1001020
Copyright License: © 2022 Arif A. This is an open access article distributed under the Creative Commons Attribution License, which permits unrestricted use, distribution, and reproduction in any medium, provided the original work is properly cited.

Effect of COVID-19 on the ambient air pollution in Tunisia during 2020 and 2021 years
Abderrazak Arif*
National Institute of Meteorology, BP 156, 2035 Tunis-Carthage, Tunisia
*Address for Correspondence: Abderrazak Arif, PhD., National Institute of Meteorology, BP 156, 2035 Tunis-Carthage, Tunisia, Email: [email protected]; [email protected]
The epidemic of COVID-19 was reported in Wuhan, China in December 2019 and turned into a national crisis, with infected individuals diagnosed all over China [1-3]. In early March 2020, the World Health Organization (WHO) declared that the Wuhan epidemic has turned into a global pandemic. Many European countries have started to know several cases affected by this coronavirus, which is known to be highly contagious. The WHO has launched several recommendations to curb the spread of this virus and to call the general confinement establishment in the affected countries.
Tunisia, in North Africa (Figure 1), quickly took this step on March 22, 2020 and announced immediately general confinement for two weeks, renewable according to the test results [4]. Factories have been closed to limit human damage. International flights have been halted and the majority of government and private services have been halted except minimum and emergency services. Following these successive events, the air quality improved markedly during the confinement period. NASA scientists say the reduction in NO2 pollution first appeared near Wuhan, Northern Italy and France experienced a reduction of nearly 50% of their NO2 emissions during this first confinement period (March-April, 2020) and been reduced by almost 30% in China. In Tunisia, Nitrogen dioxide (NO2), Sulfur dioxide (SO2) and Carbon monoxide (CO) showed a remarkable decrease in the North and the Center of Tunisia of more than 40% during this period mainly linked to the reduction in emissions from road traffic and industries. Also, these pollutant gas concentrations have known a nearly 50% reduction during the 3rd pandemic wave during the period of January-April 2021.
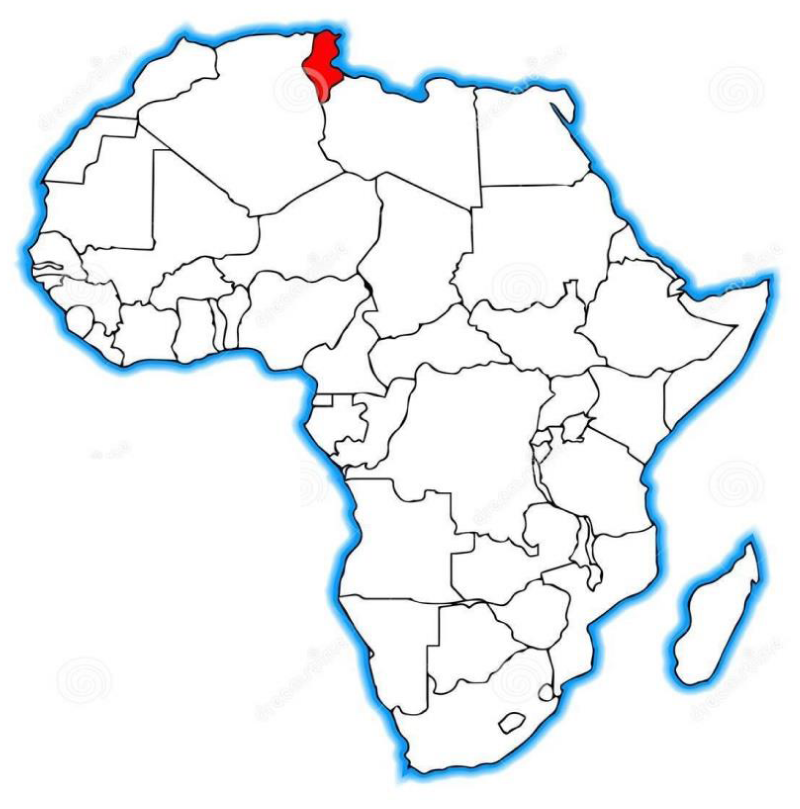
Figure 1: Tunisia location map in Africa.
Air quality improved significantly during the first confinement that lasted almost a month and a half (March and April 2020) in Tunisia. This period is characterized by the first wave of the new epidemic that its history began in Wuhan, China at the end of 2019 when the first case of COVID-19 was reported. Later, this epidemic turned into a national crisis, with infected individuals diagnosed across the country [1,3]. Transportation and travel to and from Wuhan have been halted. Then, they closed schools and universities to reduce the spread of the disease and established numerous quarantines [5]. In early March 2020, the World Health Organization (WHO) declared that the epidemic in Wuhan has turned into a global pandemic as several countries in North America and Europe have been affected by COVID-19. Italy, France, Spain and other European countries have started to know several cases affected by this coronavirus, known to be very contagious. The WHO has launched several recommendations to curb the spread of this virus and to call for the establishment of general confinement in the affected countries. Following the two-week confinement in Tunisia, on March 22, 2020, travel between towns was banned. Factories have been closed to limit human damage. A dramatic decrease in Nitrogen dioxide (NO2), Sulfur dioxide (SO2) and Carbon monoxide (CO), which are polluting gases caused mainly by human activities, was observed during the confinement period in several Tunisian cities and in particular in the North and in the Center, using satellite measurements of the European center with the European Earth monitoring program – COPERNICUS. The data was analyzed and developed at the National Institute of Meteorology of Tunisia. Following these successive events, the air quality improved markedly during these confinement periods of 2020 and 2021; known as the COVID-19 first wave [4]. A spectacular fall in Nitrogen dioxide (NO2), Sulfur dioxide (SO2) and Carbon monoxide (CO) produced mainly by human activities, was observed during these periods and after, especially in May 2020 and 2021, in several Tunisian regions and in particular in the North (Grand-Tunis and neighboring regions) using satellite measurements of Sentinel-5P (Figures 2-4). As NO2 is a common tracer of air pollution linked to human activity and associated with morbidity and mortality [6-9], NASA scientists said that the reduction in this pollutant (NO2) appeared first near Wuhan, but spread to the rest of the country and eventually worldwide [9,10]. Also, Northern Italy and France saw a reduction of nearly 50% of their NO2 emissions during this confinement period. In central China, NO2 emissions have been reduced by almost 25% [11]. SO2 emissions, another common marker of air pollution, have fallen by over 50% in northern Tunisia (Figure 5), Mumbai, New York and Los Angeles by nearly 33%, Madrid at 50%, Seoul by 50% and Wuhan by 42% [12]. Air pollution is responsible for many deaths and an increased incidence of respiratory illnesses [13]. According to the World Health Organization (WHO), nearly 4.6 million people die each year from diseases related to poor air quality [14,15], responsible for more deaths each year than motor vehicle accidents [16]. Deaths associated with air pollution include, but are not limited to, aggravated asthma, bronchitis, emphysema, lung and heart disease and respiratory allergies [13]. China, where the COVID-19 epidemic began, is also a country severely affected by air pollution [7,8]. Air pollution in China is responsible for 4,000 deaths every day, or 1, 6 million deaths in 2016 [17,18]. Scientific studies have mentioned that mortality due to air pollution represents a rate of 0.13% per day [7,8] to 2% for 10 μg/m3 of NO2 over a period of 5 days [19,20]. Considering the huge decrease in air pollution following quarantine around the world, the COVID-19 pandemic paradoxically could have reduced the total number of deaths during this period, by drastically reducing the number of deaths due to air pollution. Moreover, in addition to the number of reduced deaths from air pollution, the reduction in this list could also have positive benefits in reducing preventable no transmissible diseases.
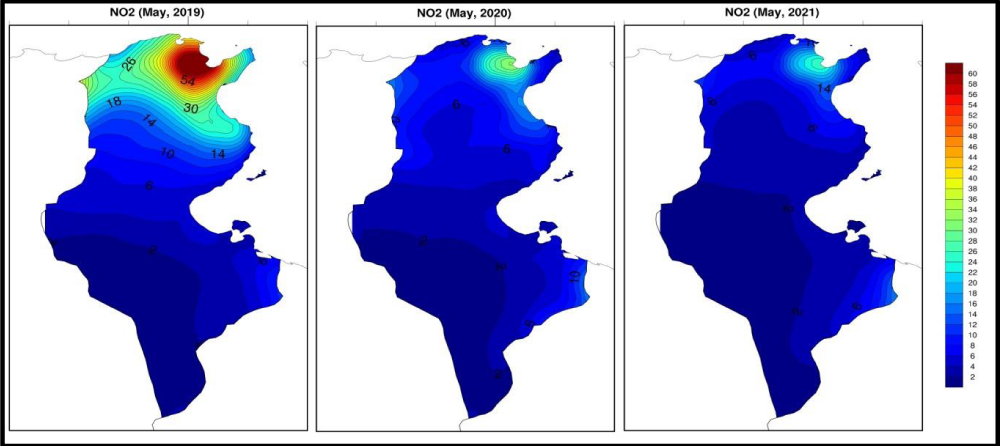
Figure 2: Regional distribution of the monthly mean Nitrogen dioxide concentration (NO2) at ground level for May 2019, 2020 and 2021 (unit μg/m3).
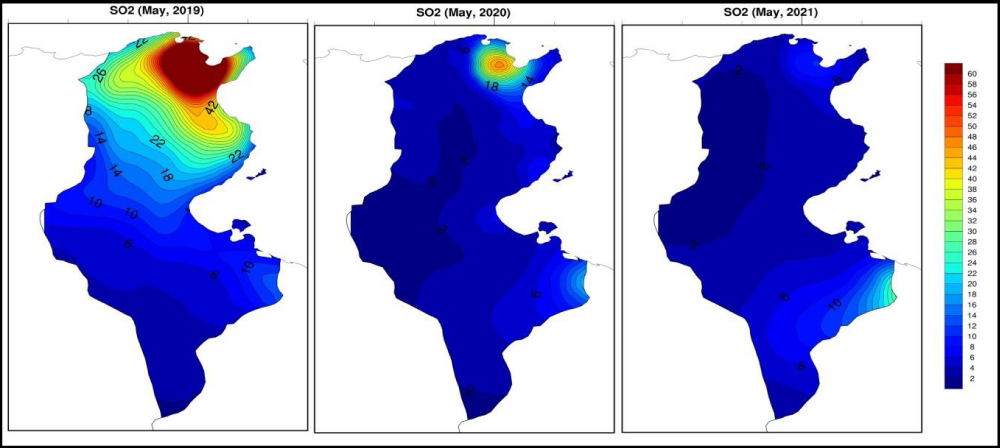
Figure 3: Regional distribution of the monthly mean Sulfur dioxide concentration (SO2) at ground level for May 2019, 2020 and 2021 (unit μg/m3).
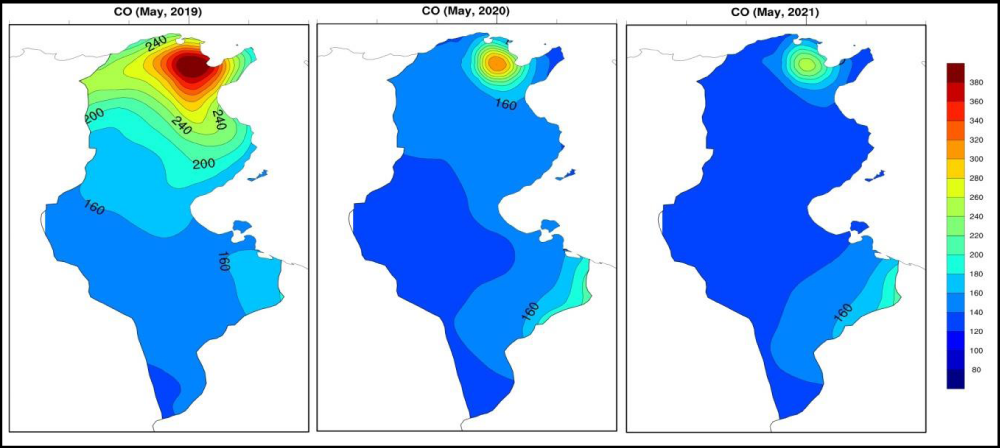
Figure 4: Regional distribution of the monthly mean Carbon monoxide (CO) at ground level for May 2019, 2020 and 2021 (unit μg/m3).

Figure 5: Daily mean of the surface Sulfur dioxide concentration (SO2, µg/m3) for North, Centre and South of Tunisia for the May 2019-2021 period.
As the Tunisian cities majority have been infected by this new COVID-19, we have selected the air pollution data from 2019 year (one year before this pandemic) until to date (December 2021) in order to analyze the trends of surface pollutants before and after this phenomenon. We used data collected daily from 00h TU to calculate the monthly concentrations mean of the four air pollutants; namely Nitrogen dioxide NO2, Sulfur dioxide SO2, Carbon monoxide CO and Ozone (O3). We have monitored the monthly trends of these pollutants from this pandemic onset (December 2019) in order to compare them with previous periods. The appearance of the first COVID-19 wave which began in March-April 2020, the air quality has changed mainly due, on the one hand, to the country’s actions to contain the COVID-19 spread and on the other hand, to the general atmospheric circulation. We looked at air pollution during the first four months of 2020 and assessed whether there were linear trends in pollutant concentrations due to the protection and confinement measures imposed by the government due to this pandemic. We then compared these concentrations before and after COVID-19 for the majority of the affected cities.
Using the Tunisian domain data (30 to 37.5-degree latitude and 7.5 to 11.5-degree longitude coordinates domain), the mean monthly data treatment of these pollutants showed remarkable changes mainly during the first period of confinement 2020 and after linked to the decrease in road traffic emissions and industries influenced by the general atmospheric circulation on a regional and global scale. The Ozone pollutant at the surface level showed an insignificant variability (slight growth) due mainly to a combination of oxygen and nitrogen gases, which occurs most often in the context of high-temperature combustion phenomena in the excess oxygen presence [4]. This type of combustion can occur in the context of natural phenomena such as in thunderstorms presence, a high temperature prevailing in the lightning vicinity, or around forest fires and results as a result of human activities [21]. Monthly graphics have also been produced for the majority of Tunisian regions, making it possible to visualize the effects of confinement on air quality. It is interested in Nitrogen dioxide (NO2), Sulfur dioxide (SO2) and Carbon monoxide (CO) concentrations, pollutants known to have deleterious effects on human health. Here, we compare a normal situation (from the previous year, 2019) to the observed situation after the first COVID-19 wave of 2020 and after the third COVID-19 wave beginning in January 2021. This generalized decrease in pollution was observed to have an impact on health and climate. According to the data collected, all of Europe, North America and China have seen this decrease. The monthly graphics show remarkable differences in these pollutant concentrations in Tunisia for May 2020 and 2021 compared to the previous May, mainly in the North, Centre and South of Tunisia. Nitrogen dioxide (NO2), Sulfur dioxide (SO2) and Carbon monoxide (CO) showed an important decrease of more than 40% especially in the North and Centre of Tunisia during the confinement periods of 2020 and 2021 linked mainly to the emissions decreasing from road traffic and industries (Figures 5-7).
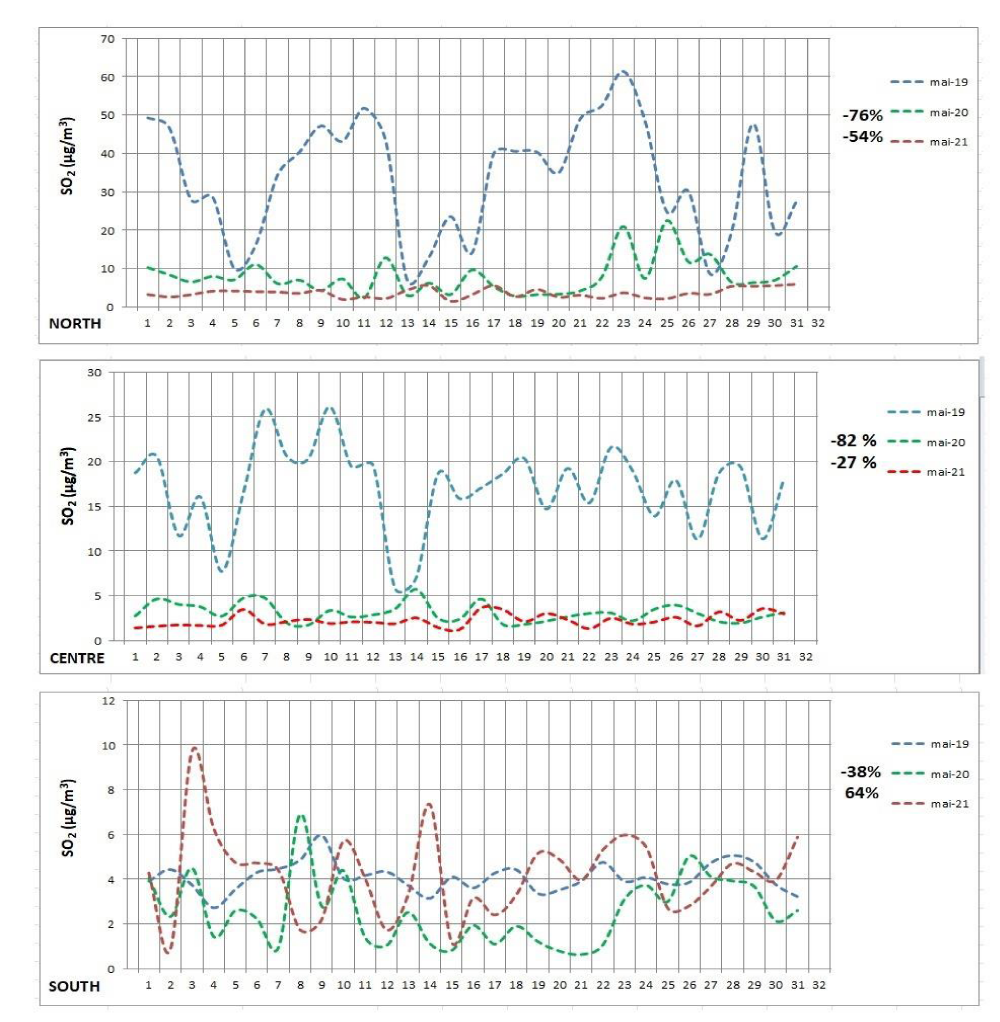
Figure 6: Daily mean of the surface Nitrogen dioxide concentration (NO2, µg/m3) for North, Centre and South of Tunisia for the May, 2019-2021 period.
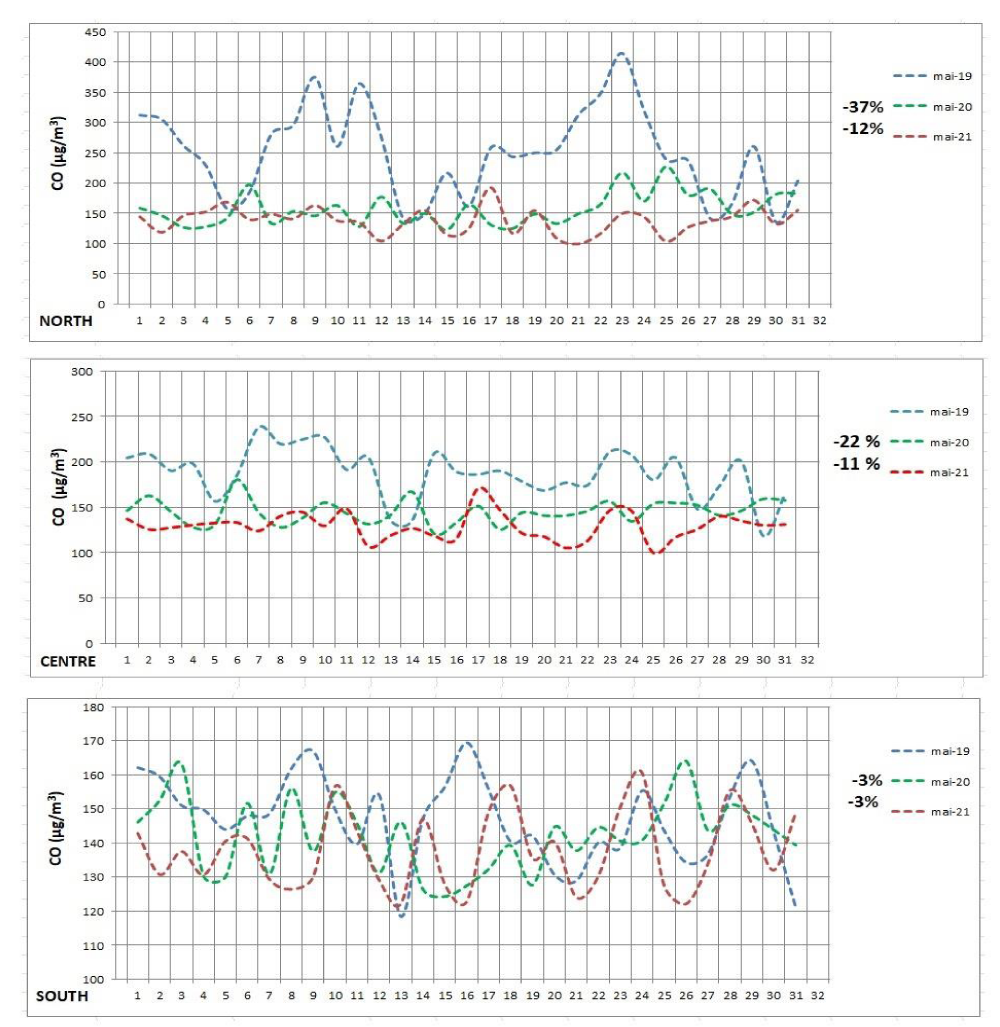
Figure 7: Daily mean of the surface Carbon monoxide (CO, µg/m3) for North, Centre and South of Tunisia for May, 2019-2021 period.
The air quality appears to be improved in almost all regions following the government’s COVID-19 pandemic protective measures introduction. Thus, this study shows that the gradual limitation of industrial activity and automobile traffic in Tunisia caused by COVID-19 pandemic protective measures have been accompanied by an apparent decrease in air pollution and air quality index in Tunisian regions, especially in the north and the center. In other words, the effect of this horrible virus has brought us back to cleaner air.
- Chan JF, Yuan S, Kok KH, To KK, Chu H, Yang J, Xing F, Liu J, Yip CC, Poon RW, Tsoi HW, Lo SK, Chan KH, Poon VK, Chan WM, Ip JD, Cai JP, Cheng VC, Chen H, Hui CK, Yuen KY. A familial cluster of pneumonia associated with the 2019 novel coronavirus indicating person-to-person transmission: a study of a family cluster. Lancet. 2020 Feb 15;395(10223):514-523. doi: 10.1016/S0140-6736(20)30154-9. Epub 2020 Jan 24. PMID: 31986261; PMCID: PMC7159286.
- Huang C, Wang Y, Li X, Ren L, Zhao J, Hu Y, Zhang L, Fan G, Xu J, Gu X, Cheng Z, Yu T, Xia J, Wei Y, Wu W, Xie X, Yin W, Li H, Liu M, Xiao Y, Gao H, Guo L, Xie J, Wang G, Jiang R, Gao Z, Jin Q, Wang J, Cao B. Clinical features of patients infected with 2019 novel coronavirus in Wuhan, China. Lancet. 2020 Feb 15;395(10223):497-506. doi: 10.1016/S0140-6736(20)30183-5. Epub 2020 Jan 24. Erratum in: Lancet. 2020 Jan 30;: PMID: 31986264; PMCID: PMC7159299.
- WHO. Novel Coronavirus (2019-nCoV) situation report - 1 21 January 2020.
- Arif A. Confinement and coronavirus: Falling air pollution in Tunisia. Technical report, National Institute of Meteorology. Tunisia. 2020: https://www.meteo.tn/en/actualites/scientific-publication,32 pages.
- Wilder-Smith A, Freedman DO. Isolation, quarantine, social distancing and community containment: pivotal role for old-style public health measures in the novel coronavirus (2019-nCoV) outbreak. J Travel Med. 2020 Mar 13;27(2):taaa020. doi: 10.1093/jtm/taaa020. PMID: 32052841; PMCID: PMC7107565.
- Crouse DL, Peters PA, Hystad P, Brook JR, van Donkelaar A, Martin RV, Villeneuve PJ, Jerrett M, Goldberg MS, Pope CA 3rd, Brauer M, Brook RD, Robichaud A, Menard R, Burnett RT. Ambient PM2.5, O₃, and NO₂ Exposures and Associations with Mortality over 16 Years of Follow-Up in the Canadian Census Health and Environment Cohort (CanCHEC). Environ Health Perspect. 2015 Nov;123(11):1180-6. doi: 10.1289/ehp.1409276. Epub 2015 Nov 1. PMID: 26528712; PMCID: PMC4629747.
- He L, Zhang S, Hu J, Li Z, Zheng X, Cao Y, Xu G, Yan M, Wu Y. On-road emission measurements of reactive nitrogen compounds from heavy-duty diesel trucks in China. Environ Pollut. 2020 Jul;262:114280. doi: 10.1016/j.envpol.2020.114280. Epub 2020 Feb 29. PMID: 32146368.
- He MZ, Kinney PL, Li T, Chen C, Sun Q, Ban J, Wang J, Liu S, Goldsmith J, Kioumourtzoglou MA. Short- and intermediate-term exposure to NO2 and mortality: A multi-county analysis in China. Environ Pollut. 2020 Jun;261:114165. doi: 10.1016/j.envpol.2020.114165. Epub 2020 Feb 13. PMID: 32097792; PMCID: PMC7220820.
- Ortiz C, Linares C, Carmona R, Díaz J. Evaluation of short-term mortality attributable to particulate matter pollution in Spain. Environ Pollut. 2017 May;224:541-551. doi: 10.1016/j.envpol.2017.02.037. Epub 2017 Feb 23. PMID: 28237303.
- Wang Q, Su M. A preliminary assessment of the impact of COVID-19 on environment - A case study of China. Sci Total Environ. 2020 Aug 1;728:138915. doi: 10.1016/j.scitotenv.2020.138915. Epub 2020 Apr 22. PMID: 32348946; PMCID: PMC7195154.
- Wang Q, Su M. A preliminary assessment of the impact of COVID-19 on environment - A case study of China. Sci Total Environ. 2020 Aug 1;728:138915. doi: 10.1016/j.scitotenv.2020.138915. Epub 2020 Apr 22. PMID: 32348946; PMCID: PMC7195154.
- Gope S, Subhojit Dawn2, Shreya Shree Das. Effect of COVID-19 pandemic on air quality: a study based on Air Quality Index. 2020. Environmental Science and Pollution Research: https://doi.org/10.1007/s11356-021-14462-9.
- Brauer M. How much, how long, what, and where: air pollution exposure assessment for epidemiologic studies of respiratory disease. Proc Am Thorac Soc. 2010 May;7(2):111-5. doi: 10.1513/pats.200908-093RM. PMID: 20427581.
- Chen S, Bloom DE. The macroeconomic burden of noncommunicable diseases associated with air pollution in China. PLoS One. 2019 Apr 18;14(4):e0215663. doi: 10.1371/journal.pone.0215663. PMID: 30998763; PMCID: PMC6472813.
- Cohen AJ, Brauer M, Burnett R, Anderson HR, Frostad J, Estep K, Balakrishnan K, Brunekreef B, Dandona L, Dandona R, Feigin V, Freedman G, Hubbell B, Jobling A, Kan H, Knibbs L, Liu Y, Martin R, Morawska L, Pope CA 3rd, Shin H, Straif K, Shaddick G, Thomas M, van Dingenen R, van Donkelaar A, Vos T, Murray CJL, Forouzanfar MH. Estimates and 25-year trends of the global burden of disease attributable to ambient air pollution: an analysis of data from the Global Burden of Diseases Study 2015. Lancet. 2017 May 13;389(10082):1907-1918. doi: 10.1016/S0140-6736(17)30505-6. Epub 2017 Apr 10. Erratum in: Lancet. 2017 Jun 17;389(10087):e15. Erratum in: Lancet. 2018 Apr 21;391(10130):1576. PMID: 28408086; PMCID: PMC5439030.
- European Environment Agency. Communication from the Commission to the Council and the European Parliament - Thematic Strategy on Air Pollution. 2005.
- Rohde RA, Muller RA. Air Pollution in China: Mapping of Concentrations and Sources. PLoS One. 2015 Aug 20;10(8):e0135749. doi: 10.1371/journal.pone.0135749. PMID: 26291610; PMCID: PMC4546277.
- Wang H, Dwyer-Lindgren L, Lofgren KT, Rajaratnam JK, Marcus JR, Levin-Rector A, Levitz CE, Lopez AD, Murray CJ. Age-specific and sex-specific mortality in 187 countries, 1970-2010: a systematic analysis for the Global Burden of Disease Study 2010. Lancet. 2012 Dec 15;380(9859):2071-94. doi: 10.1016/S0140-6736(12)61719-X. PMID: 23245603.
- Chiusolo M, Cadum E, Stafoggia M, Galassi C, Berti G, Faustini A, Bisanti L, Vigotti MA, Dessì MP, Cernigliaro A, Mallone S, Pacelli B, Minerba S, Simonato L, Forastiere F; EpiAir Collaborative Group. Short-Term Effects of Nitrogen Dioxide on Mortality and Susceptibility Factors in 10 Italian Cities: The EpiAir Study. Environ Health Perspect. 2011 Sep;119(9):1233-8. doi: 10.1289/ehp.1002904. Epub 2011 May 17. PMID: 21586369; PMCID: PMC3230391.
- Hoek G, Krishnan RM, Beelen R, Peters A, Ostro B, Brunekreef B, Kaufman JD. Long-term air pollution exposure and cardio- respiratory mortality: a review. Environ Health. 2013 May 28;12(1):43. doi: 10.1186/1476-069X-12-43. PMID: 23714370; PMCID: PMC3679821.
- Arif A. Lightning activity and Climate Change with NCEP and CRCM data: Canada and Northern United States regions. Editions Universitaires Europeans. 2012; ISBN-13: 978-3-8417-9647-9. 136 pages.