
More Information
Submitted: March 07, 2024 | Approved: March 28, 2024 | Published: March 29, 2024
How to cite this article: Morshed N, Weaver R, Benjamin Zhan F. Causal Mediation Analysis for Childhood Cancer Survival Disparity in Texas, 2005 to 2014. J Community Med Health Solut. 2024; 5: 023-030.
DOI: 10.29328/journal.jcmhs.1001044
Copyright License: © 2024 Morshed N, et al. This is an open access article distributed under the Creative Commons Attribution License, which permits unrestricted use, distribution, and reproduction in any medium, provided the original work is properly cited.
Keywords: Childhood cancer; Race-ethnicity; Disparities; Healthcare access; Socio-economic status; Survival

Causal Mediation Analysis for Childhood Cancer Survival Disparity in Texas, 2005 to 2014
Niaz Morshed1* , Russell Weaver2 and F Benjamin Zhan1
1Department of Geography and Environmental Studies, Texas State University, 601 University Drive, San Marcos, TX 78666, USA
2ILR Buffalo Co-Lab, Cornell University, Ithaca, NY 14853, USA
*Address for Correspondence: Niaz Morshed, PhD, Department of Geography and Environmental Studies, Texas State University, 601 University Drive, San Marcos, TX 78666, USA, Email: [email protected]
This study aimed to examine the disparities of childhood cancer survival among different racial and ethnic groups in Texas. The analysis was mediated by socioeconomic status (SES) and spatial accessibility to Children Oncology Group (COG) hospitals. The relationship between race-ethnicity and overall survival was measured using the Cox proportional hazards model with a robust variance estimator. The counterfactual model measures the total effect of race-ethnicity on survival through all mediating pathways while adjusting for baseline confounders (age, sex, and stage at diagnosis), which are then decomposed into natural direct and indirect effects. Considering all cancer site groups, African Americans showed a statistically significant higher hazard ratio in death (HR = 3.63; 95% CI = 1.87 - 6.62) compared with non-Hispanic White children. At the same time, the mortality hazard ratio among Hispanic children is not significant (HR = 1.23; 95% CI = 0.80 - 1.93) when compared with non-Hispanic White children. Analysis results also suggested that both mediators significantly contribute to racial-ethnic survival disparities for specific cancer site groups such as Leukemia for African American children. This study builds knowledge and understanding about underlying factors (mediators) responsible for the disparities in the outcomes among childhood cancer patients.
Over the past 50 years, childhood cancer survival has significantly improved because of advancements in medical science [1]. A growing number of cancer patients are experiencing longer cancer survivorship because of continuous improvements in treatment, therapy, and overall supportive care. Prior findings show that five-year relative survival rates in the United States, for all cancer types, increased significantly over time – from 58% during the mid-1970s to 85% from 2012 to 2018 in children, and the rate increased from 68% to 86% in adolescents in the same time [2]. The overall survival disparities are identified in adults [2,3], but less well studied in children.
Childhood cancer cases account for less than 1% of all new cancer diagnoses but play an outsized role in the trauma that families and households with cancer patients experience [4]. The International Classification of Childhood Cancer (ICCC-3) classifies childhood cancer into 12 major site groups based on the International Classification of Diseases for Oncology (ICD-O-3) [5]. Childhood cancer patients require specialized treatment facilities with multidisciplinary care only dedicated to pediatric services [6]. Children Oncology Group (COG) hospitals facilitate those services in their specialized centers ensuring equal representation of racial/ethnic groups in a clinical trial [7]. The COG accounts for 200 institutions in the United States [7,8] with only fifteen COG member institutions in Texas treating both children and adolescents, mostly clustered in urban areas [8].
Considerable research has already been done about racial/ethnic disparities in childhood cancer survival [9–11]. Several studies focused on both overall and disease-specific childhood cancer survival among demographic sub-groups [4,11], whereas a few other studies examined specific cancer types such as acute lymphoblastic leukemia (ALL) (9,10) and melanoma [12]. Hamilton and colleagues [12] reported that there is no association between socioeconomic status (SES) and distance to treatment centers with advance-stage melanoma at diagnosis, the single most important predictor of survival. They also mentioned that Hispanic patients living in the lowest SES quartile in Texas had significantly higher mortality risk compared to white patients.
Yet, despite this growing body of research, several gaps in the literature on childhood cancer disparities and survival outcomes remain. Namely, there are few if any extent studies on the underlying mechanism of childhood cancer survival disparities between different racial and ethnic groups when it is mediated by socioeconomic status and spatial accessibility to treatment facilities. As such, there is a shortage of research that attempts to estimate the total effect on childhood cancer survival between different racial and ethnic groups when operating through various mediating pathways.
The purpose of this study was to address a gap in understanding by applying methods of mediation analysis to childhood cancer survival analysis. The study quantified the disparities of childhood cancer survival among different racial and ethnic groups in Texas while accounting for socioeconomic status and spatial accessibility mediating variables. The authors compared five-year overall survival for Hispanic and African American childhood cancer patients to a reference group of non-Hispanic White patients.
Racial-ethnic differences in overall survival were examined based on the International Classification of Childhood Cancer (ICCC-3) major site groups [4]. The study adopted the state of Texas as the study area because of its large and diverse population, including the second-largest Hispanic population in the US, which provides a novel opportunity to study childhood cancer survival disparities.
Study population
The study obtained statewide childhood cancer data for individuals 0-19 years of age at diagnosis between the years 2005-2014 from the Texas Cancer Registry (TCR) in the Texas Department of State Health Services (TDSHS). There were 7,700 reported childhood cancer cases in the state of Texas from 2005 to 2014. The authors used the term childhood cancer to define both children under the age of 14 and adolescents with cancer. The study cohort included 6,899 (89.60%) cases under the age of 14, and the rest of the adolescents constituted around 10.40% of the cases. The last possible day of follow-up was December 31, 2014. The protocol of this study and the use of the data was approved by the Institutional Review Boards at both the Texas Department of State Health Services (IRB # 17-051) and Texas State University (IRB # 2017663). The study did not require consent to participate because the project did not directly involve recruiting any subjects.
Study variables
Individual-level variables: This study focused on the three most populous racial groups in Texas: non-Hispanic White persons, Hispanic persons, and African American persons. Herein, the authors use the term African Americans to mean non-Hispanic African American children. Due to low observed frequencies (3.91% of all reported cases, combined), Native American children, Asian children, and children from other racial groups were not included in the analyses. Individual-level variables collected from the TCR dataset include race-ethnicity, age at diagnosis, gender, stage at diagnosis, and tumor grade. Childhood cancer cases at diagnosis were categorized into localized, regional, and distant stages based on guidelines from the Surveillance Epidemiology End Result (SEER) program from the National Cancer Institute (NCI). The proportion of the cases that were in situ and localized, regional, distant, and not applicable or unstaged were 29% (2,157), 11% (835), 43% (3,177), and 17% (1,230), respectively. Regional and distant stages were categorized as late-stage, whereas the localized stage was characterized as early-stage based on clinical and pathological information. The study excluded cases classified as not applicable or unknown stages in the analysis.
Contextual-level variables: To measure the socioeconomic status (SES) of a patient’s home environment (census tract), the researchers performed factor analysis with variables for the percent of the labor force unemployment, the percent of the population below poverty, median household income, the percent of the households without a car, and so on [13]. Data for these variables were obtained from the US Census American Community Survey (ACS) five-year estimates (2006-2010) at the census tract level of analysis. The authors also used contextual variable spatial accessibility to COG hospitals in the analysis.
Statistical analysis
The study used a factor analysis to analyze the covariation among the observed variables. This method helps to extract several latent factors, such as socioeconomic status (SES), which accounted for most of the variation among the observed variables. Additional details on this method are available from other sources [14]. The enhanced 2-step floating catchment area (E2SFCA) method [13,14] was used to measure relative spatial access to COG hospitals. These two continuous variables were classified into four quartiles ranging from low to high.
Childhood cancer survival disparities between different racial and ethnic groups were estimated using the standard Cox proportional hazard model adjusting for all known baseline confounders. This model uses a robust variance estimator and demonstrates the relationship between race-ethnicity and overall survival. The Hazard Ratio (HR) in this model is the measure of effect (risk of failure). Individual-level variables, including disease characteristics such as age, sex, and stage at diagnosis, were used as controls.
Mediation analysis was undertaken within a counterfactual framework [15] to measure the extent to which a point exposure is mediated by an intermediate (mediator) variable on the pathway between the exposure and the outcome [16,17]. Based on the original counterfactual framework proposed by Judea Pearl (2011) [15], regardless of the precise statistical model, the total effect of the focal exposure on the outcome can be decomposed into natural direct and indirect effects [18,19]. The model reports total effects, which is the aggregation of these two effects. Additional details on this method are available from other sources [17,20,21].
Confidence intervals for the mediation effect were generated via 500 bootstrap simulations. Simple random cluster sampling accounts for the clustering of cases within census tracts. The independence of the two mediators was tested using logistic regression of spatial accessibility on socioeconomic status adjusted for other confounders. The method requires that mediators for multiple pathways analysis are mutually independent [17,22].
The study also performed a sensitivity analysis using one binary mediator representing spatial accessibility and socioeconomic status considering that two mediators operate independently from each other. Survival curves were generated using the Kaplan-Meier non-parametric method based on the survival function of standardized residuals [23]. The study also used the log-rank test to compare survival between two racial groups.
Analysis was performed in R version 3.5.0 [24] using the ‘survival’ [25], ‘geepack’ [26] and ‘rms’ [27] packages.
First, we characterized the childhood cancer dataset based on the International Classification of Childhood Cancer (ICCC). There are twelve major site groups recognized for childhood cancer [28] (Table 1). Descriptive statistics by cancer site group provided information about individual-level racial/ethnic, disease characteristics, and contextual-level features such as socioeconomic status. Leukemias, myeloproliferative diseases, and myelodysplastic diseases had the highest number of cases. The average age at diagnosis was less than six (SD 4.3) years. Hispanic children had the highest number of cases of Leukemias, myeloproliferative diseases, as well as myelodysplastic, Lymphomas, and reticuloendothelial neoplasms diseases.
It was noted that most cases of leukemias (99.69%) and lymphomas (61.61%) were diagnosed at a late stage and about half of the patients lived in socioeconomically disadvantaged areas (Table 1). Central Nervous System (CNS) and miscellaneous intracranial and intraspinal neoplasms had the second-highest number of cases with an average age of around seven (SD 4.6) years at diagnos. There were only 34 cases of ‘other and unspecified malignant neoplasms’ and 20 of them were Hispanic patients. For this type of cancer, the average age at diagnosis was around seven years, and 35% of patients lived in areas with very low socioeconomic status. The number of female cases was comparatively lower than males across the cancer site group.
| Table 1: Characteristics of childhood cancer cases diagnosed from 2005 to 2014. | |||||||||||||
| Site Group | No. | Race/Ethnicity | Stage at Diagnosis (%) | Tract-level SES, Qe (%) | |||||||||
| NHWa | HISb | AAc | Age at Diagnosis mean (SDsup>d) | Female | Early-Stage | Late-Stage | Unknown Stage | Q1 | Q2 | Q3 | Q4 | ||
| I. Leukemias, myeloproliferative diseases, and myelodysplastic diseases |
2260 | 861 | 1222 | 177 | 5.98 (4.3) | 1045 | 0.22 | 99.69 | 0.09 | 28.3 | 22.5 | 22.6 | 26.6 |
| II. Lymphomas and reticuloendothelial neoplasms | 797 | 333 | 383 | 81 | 8.97 (4.9) | 295 | 27.23 | 61.61 | 11.17 | 27.2 | 22.6 | 25.7 | 24.5 |
| III. CNS and miscellaneous intracranial and intraspinal neoplasms | 1944 | 923 | 813 | 208 | 7.24 (4.6) | 944 | 54.99 | 11.01 | 34.00 | 30.3 | 26.5 | 20.5 | 22.6 |
| IV. Neuroblastoma and other peripheral nervous cell tumors | 295 | 160 | 95 | 40 | 3.45 (3.1) | 139 | 20.68 | 68.47 | 10.85 | 33.2 | 29.2 | 19.3 | 18.3 |
| V. Retinoblastoma | 115 | 36 | 52 | 27 | 2.10 (1.9) | 65 | 57.39 | 35.65 | 6.96 | 26.1 | 20 | 23.5 | 30.4 |
| VI. Renal tumors | 332 | 134 | 142 | 56 | 3.80 (2.9) | 181 | 34.64 | 59.64 | 5.72 | 34.6 | 18.7 | 22.6 | 24.1 |
| VII. Hepatic tumors | 91 | 36 | 47 | 8 | 3.85 (3.9) | 37 | 38.46 | 54.95 | 6.59 | 36.3 | 24.2 | 12.1 | 27.5 |
| VIII. Malignant bone tumors | 273 | 114 | 126 | 33 | 10.5 (4.1) | 123 | 43.22 | 45.05 | 11.72 | 30.0 | 24.5 | 20.9 | 24.5 |
| IX. Soft tissue and other extraosseous sarcomas | 601 | 280 | 244 | 77 | 7.80 (4.9) | 260 | 29.62 | 27.95 | 42.43 | 28.5 | 25.6 | 22.6 | 23.3 |
| X. Germ cell tumors, trophoblastic tumors, and neoplasms of gonads | 250 | 94 | 130 | 26 | 10.76 (5.3) | 134 | 51.6 | 36.4 | 12 | 32 | 18.8 | 22 | 27.2 |
| XI. Other malignant epithelial neoplasms and malignant melanomas | 425 | 210 | 177 | 38 | 12.08 (4.2) | 275 | 38.59 | 42.35 | 19.06 | 30.1 | 26.1 | 23.1 | 20.7 |
| XII. Other and unspecified malignant neoplasms | 34 | 10 | 20 | 4 | 7.35 (5.5) | 16 | 20.59 | 29.41 | 50 | 17.6 | 14.7 | 32.4 | 35.3 |
| aNon-Hispanic Whites; bHispanics; cAfrican Americans; dStandard Deviation; eQuantile. | |||||||||||||
The study employed meditation analysis to investigate childhood cancer survival disparities among different racial and ethnic groups after accounting for SES and spatial accessibility mediators. Before we ran the mediation analysis, we checked whether these two mediators were statistically independent using a logistic regression analysis. An independence test of the two mediators for African American and white patients revealed no issue of dependency. However, the null hypothesis of independence for the two mediators was rejected (p < 0.001) when comparing Hispanic and white patients. As such, the results from these comparisons must be approached with slightly more caution, though their strength and consistency with expectations suggest that they reasonably describe disparities in the outcome variables. That being said, Table 2 shows the mediating effect of SES and spatial accessibility on childhood cancer overall survival.
| Table 2: Survival disparities of African American and Hispanic children compared with non-Hispanic White children from 2005 to 2014. | ||||||
| Variables | Total effect on survival through all mediating pathways | Direct effect on survival after Blocking SES & SAc pathways | Indirect effect on survival operating through SES & SA pathways | |||
| Race/ Ethnicity | Mortality HRa | 95% CIb | Mortality HR | 95% CI | Mortality HR | 95% CI |
| NHW | Reference (1.00) | |||||
| AA | 3.626 | 1.87 - 6.62 | 1.536 | 1.23 - 1.88 | 2.360 | 1.52 - 3.53 |
| HIS | 1.228 | 0.80 - 1.93 | 1.071 | 0.93 - 1.25 | 1.146 | 0.86 - 1.55 |
| Sensitivity analysis | ||||||
| NHW | Reference (1.00) | |||||
| AA | 2.301 | 1.23 - 2.93 | 1.517 | 1.22 - 1.92 | 1.517 | 1.32 - 1.92 |
| HIS | 1.121 | 0.72 - 1.62 | 1.059 | 0.86 - 1.16 | 1.059 | 0.83 - 1.21 |
| aHazard ratio; bConfidence Interval; cSpatial Accessibility. Adjusted for age, sex, and stage at diagnosis; Bootstrapping was used for standard error. |
||||||
Considering all cancer site groups, African Americans had a statistically significantly higher mortality rate compared with non-Hispanic White patients. Two mediators significantly contributed to racial-ethnic survival disparities. The hazard ratio (HR) was as high as 3.626, with a 95% confidence interval of 1.87 to 6.62. The total effect was decomposed into direct HR of race-ethnicity of 1.536 (95% CI: 1.23 to 1.88) and indirect HR for spatial accessibility and SES mediators of 2.360 (95% CI: 1.52 to 3.53). Next, Hispanic children had a relatively lower mortality rate compared with their white counterparts (HR 1.228, 95% CI: 0.80 to 1.93). The total mortality hazard decomposed into a direct HR of 1.071 (95% CI: 0.93 to 1.25) and an indirect HR for both mediators of 1.146 (95% CI: 0.86 to 1.55).
Sensitivity analysis was performed using a single binary mediator reflecting optimal adherence to both mediators in the sense that both spatial accessibility and socioeconomic status are considered optimal. The logistic regression result also shows that childhood cancer survival disparities exist among different racial and ethnic groups based on the aggregated mediator, with a hazard ratio of 2.301 (statistically significant) and 1.121 for African American and Hispanic patients, respectively.
Table 3 shows the childhood cancer survival disparities in white and African American patients based on cancer site groups. African Americans showed a statistically significant higher hazard ratio for leukemia. This might be an overestimation, however, as there was a small number of African American cases compared to cases among white children. SES and spatial accessibility contributed to some extent to the survival disparities between African American and white patients for cancer site groups including lymphomas, CNS tumors, soft tissue sarcomas, and germ cell tumors. None of them turned out to be statistically significant.
| Table 3: Survival disparities of African Americans and non-Hispanic Whites based on on-site group. | ||||||
| Variables NHW/AA |
Total effect on survival through all mediating pathways | Direct effect on survival after Blocking SES & SA pathway | The indirect effect on survival operating through the SES & SA pathway | |||
| Site Group | Mortality HR | 95 % CI | Mortality HR | 95 % CI | Mortality HR | 95 % CI |
| I. | 10.182 | 7.12 - 20.15 | 2.167 | 1.92 - 2.72 | 4.698 | 3.69 - 7.40 |
| II. | 2.394 | 0.06 - 31.94 | 1.338 | 0.39 - 3.17 | 1.790 | 0.15 - 10.06 |
| III. | 2.406 | 0.82 - 6.65 | 1.340 | 0.94 - 1.88 | 1.796 | 0.88 - 3.54 |
| IV.* | ||||||
| V.* | ||||||
| VI.* | ||||||
| VII. | 0.128 | 0.01 - 1.59 | 0.504 | 0.23 - 1.13 | 0.254 | 0.05 - 1.33 |
| VIII. | 3.888 | 0.22 - 88.98 | 1.572 | 0.60 - 4.47 | 2.473 | 0.36 - 19.93 |
| IX. | 4.841 | 0.73 - 40.62 | 1.692 | 0.90 - 3.44 | 2.862 | 0.81 - 11.81 |
| X.* | ||||||
| XI. | 0.592 | 0.03 - 13.64 | 0.840 | 0.29 - 2.38 | 0.705 | 0.09 - 5.70 |
| XII.* | ||||||
| *Results not reported due to low observed frequency for at least one racial group. Adjusted for age, sex and stage at diagnosis; Bootstrapping was used for standard error; Roman number refers to site group in Table 1. |
||||||
Figure 1 shows the Kaplan-Meier non-parametric survival curve based on the survival function of standardized residuals. The proportion of cases surviving the past five years (60 months) was 78% for white and 70% for African American patients. The median length of survival was approximately 130 months for both non-Hispanic White and African American patients. In addition, the global log-rank test resulted in a high chi-square value (χ2:19.1; 1df; p < 0.001), suggesting that these two survival curves are not identical.
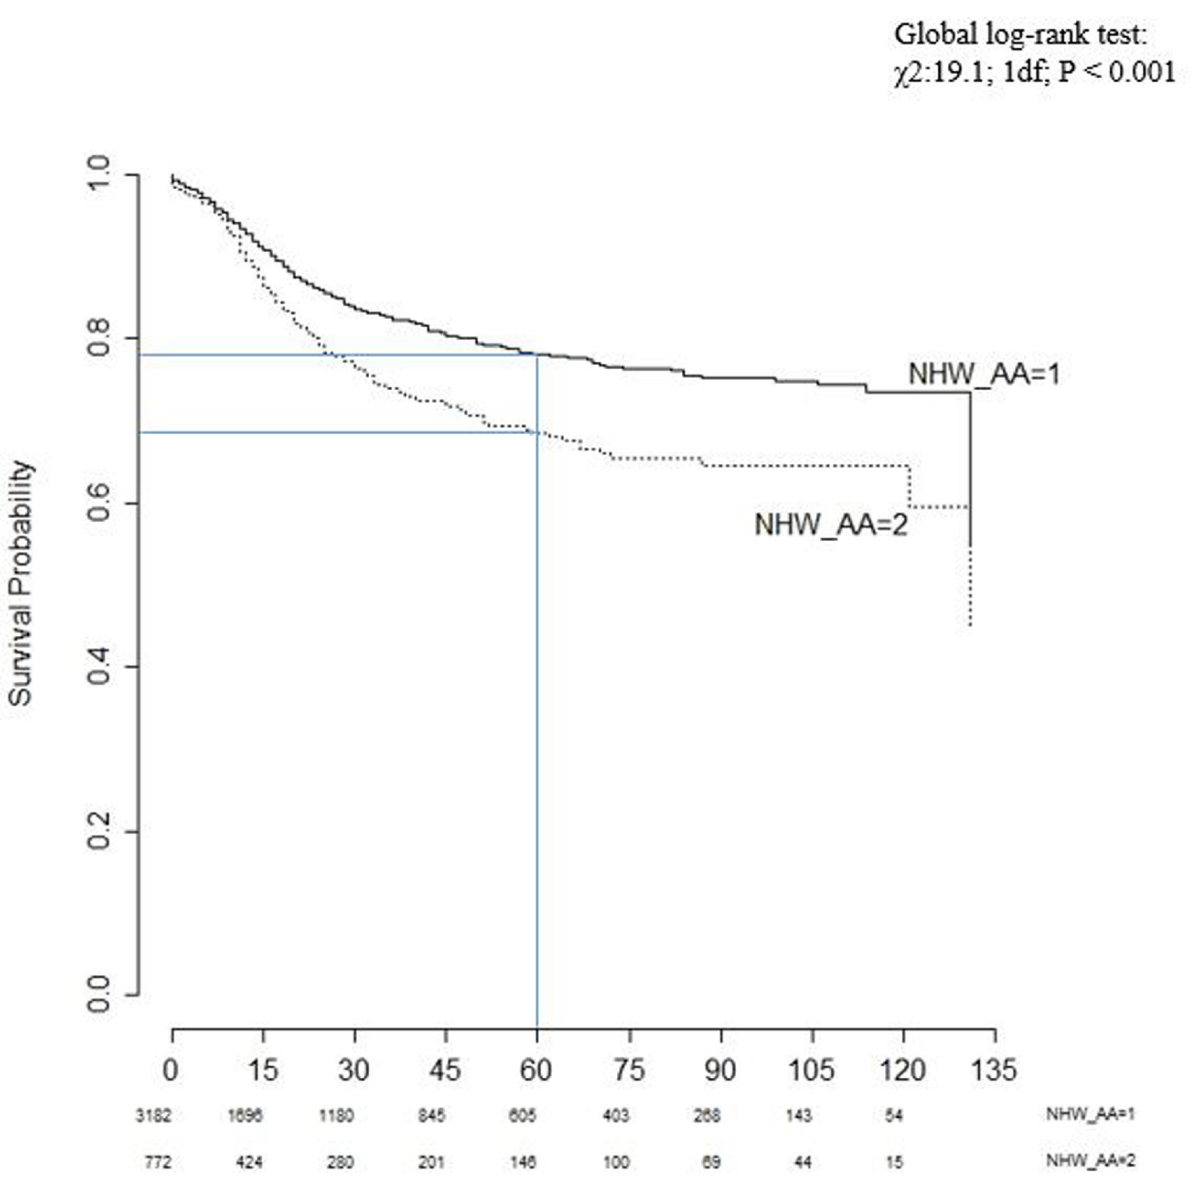
Figure 1: Kaplan-Meier survival curves for non-Hispanic White (1) and African American (2) children.
Table 4 shows the childhood cancer survival disparities between Hispanics and non-Hispanic White patients. The results suggest that SES and spatial accessibility also mediated the effects of race-ethnicity on survival disparities for several cancer site groups, which were statistically not significant, for instance, Hispanic children had an increased risk of 118% of mortality hazard for leukemias compared with non-Hispanic White children.
| Table 4: Survival disparities of Hispanics and non-Hispanic Whites based on on-site group. | ||||||
| Variables (NHW/HIS) |
Total effect on survival through all mediating pathways | Direct effect on survival after Blocking SES & SA Pathway | The indirect effect on survival operating through the SES & SA pathway | |||
| Site Group | Mortality HR | 95 % CI | Mortality HR | 95 % CI | Mortality HR | 95 % CI |
| I. | 2.180 | 0.92 - 4.99 | 1.300 | 0.97 - 1.71 | 1.680 | 0.94 - 2.92 |
| II. | 0.720 | 0.09 - 4.77 | 0.896 | 0.45 - 1.68 | 0.803 | 0.20 - 2.84 |
| III. | 1.831 | 0.91 - 3.93 | 1.223 | 0.97 - 1.58 | 1.497 | 0.94 - 2.49 |
| IV.* | ||||||
| V.* | ||||||
| VI.* | ||||||
| VII. | 0.198 | 0.05 - 3.57 | 0.582 | 0.37 -1.51 | 0.339 | 0.14 - 2.31 |
| VIII. | 1.148 | 0.20 - 9.48 | 1.047 | 0.59 - 2.12 | 1.097 | 0.34 - 4.48 |
| IX. | 1.917 | 0.30 - 8.85 | 1.242 | 0.67 - 2.07 | 1.543 | 0.44 - 4.28 |
| X.* | ||||||
| XI. | 1.675 | 0.07 - 47.06 | 1.188 | 0.41 - 3.61 | 1.410 | 0.17 - 13.03 |
| XII.* | ||||||
| *Results not reported due to low observed frequency for at least one racial group. Adjusted for age, sex, and stage at diagnosis; Bootstrapping was used for standard error. |
||||||
Figure 2 shows the Kaplan-Meier survival curves for non-Hispanic white and Hispanic patients. The proportion of cases surviving the past five years (60 months) was 78% and 76% for white and Hispanic children, respectively. The global log-rank test provided a very small chi-square value (χ2: 1.30; 1df; p = 0.30). In other words, the empirical evidence suggests that the two survival curves are statistically indistinguishable. Indeed, the two curves also crossed each other over time.
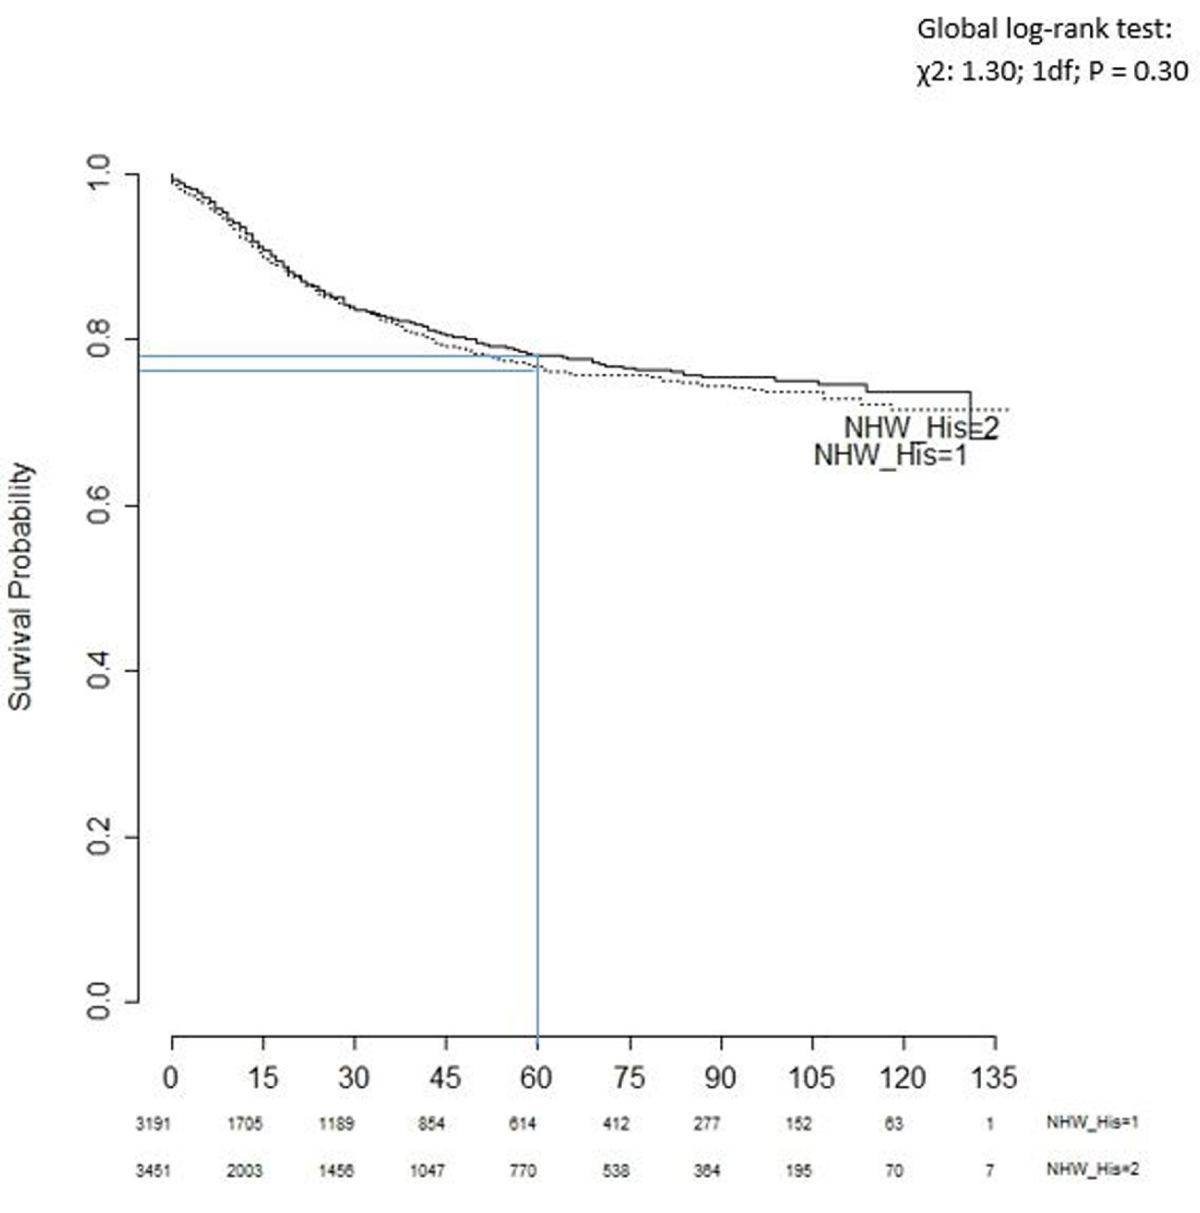
Figure 2: Kaplan-Meier survival curves for non-Hispanic White (1) and Hispanic (2) children.
The US Department of Health and Human Services aimed to achieve five overarching goals in its ‘Healthy People 2030’ campaign. The second of these goals pointed out the importance of ‘Eliminating health disparities and achieving health equity’ [29]. The continuous improvement in survival and reduction in cancer mortality for disadvantaged groups can contribute significantly to the elimination of health disparities [30]. Geographic locations, race-ethnicity, sex, age group, and socioeconomic status are common indicators of disparities in childhood cancer [31,32], a better understanding of the disparities of childhood cancer survival is an important step toward developing more effective programs in addressing childhood cancer disparities.
Cancer outcome is known to be impacted by differences in socioeconomic status. This important indicator has not been examined thoroughly in childhood cancer survival analysis. Results from previous studies did not find SES significantly associated with delayed diagnosis [33,34] and a higher risk of childhood cancer [35]. This study innovatively used mediation analysis to examine how SES and spatial accessibility to COG hospitals would affect the survival of childhood cancer patients in Texas.
Findings from mediation analysis in this study indicate that SES and spatial accessibility contributed significantly to childhood cancer survival disparity (African Americans versus non-Hispanic Whites). We also investigated the relationship between race-ethnicity and overall survival while considering the effect of two binary mediators - optimal socioeconomic status and optimal spatial accessibility. Results from this study indicate that African Americans living in areas with higher SES had higher survival rates (Wald test, W = 103.99, p < 0.001). The Wald test score for optimal spatial accessibility was (W = 1.22, p = 0.2684) in favor of African Americans, which was not statistically significant. The overall survival operating through (Indirect effect) SES and spatial accessibility pathways showed higher risk compared with that without considering these two factors. The sensitivity analysis results included effect estimates and confidence intervals that generally corroborate with the primary analyses.
The Kaplan-Meier survival test indicated that the survival probabilities for non-Hispanic Whites are higher than the survival probabilities for African-American children (Figure 1).
There is a statistically significant difference in survival between these two groups based on the non-parametric log-rank test. The survival benefit remained stable even after controlling for known baseline confounders, also adjusting for cases within census tracts in a multivariable Cox proportional hazard model. However, both survival and global log-rank tests for Hispanics and non-Hispanic Whites indicated that there was no significant difference in survival between these two groups (Figure 2). Our results corroborate with findings from previous population-based SEER 9 registries studies from 1995 -1999 [11], Acute Lymphoblastic Leukemia (ALL) cases from 1973 – 1999 [10] and ALL cases from 1983-1995 in Children’s Cancer Group (CCG) [9].
There are several strengths in this current study. First, the study uses a population-based state-wide cancer registry dataset of childhood cancer, which reduces the potential for selection bias relative to hospital-based studies. Second, this is the first study to report the underlying mechanism of race-ethnicity on overall survival for childhood cancer patients when mediated by socioeconomic status and spatial accessibility. Third, the study also reported the total effect on childhood cancer survival among different racial and ethnic groups, and their respective direct and indirect effect, based on major cancer site group that operates through these two mediators.
This study has a couple of limitations. First, this study did not use all factors that may affect SES, such as the study was unable to use individual case family income for the SES indicator because this information was not available. Second, the Kaplan-Meier survival curve for Hispanics and non-Hispanic Whites had crossed each other. The hazard ratio for this model would not be a useful measure because the assumption for the model might not hold as those curves aligned in some areas [36]. Third, the independence of the two mediators test for non-Hispanic Whites and Hispanics appears to be significant. One needs to be extra cautious while performing mediation analysis for these racial groups using these same mediators. Mutually independent mediators are required for the analysis of multiple pathways.
This study revealed that there are significant disparities in childhood cancer survival among African American children when compared with non-Hispanic White children. In addition, findings from this study also suggest that socioeconomic status and spatial accessibility to COG hospitals significantly contribute to these disparities for specific cancer site groups, especially for Leukemia.
Results from this study may be useful to assist healthcare professionals in developing more effective childhood cancer intervention programs. Intervention programs should be designed to help children and adolescents with cancer, in particular, African Americans living in remote and socioeconomically disadvantaged areas. Future studies will examine childhood cancer survival disparities among different racial and ethnic groups for specific cancer types accounting for other potential mediators alongside socioeconomic status and spatial accessibility to COG hospitals. In addition, future research could incorporate childhood cancer risk factors in association with additional individual-level factors, which will provide valuable information about survivorship and overall disparities.
This article is based on Niaz Morshed’s dissertation completed at Texas State University under F. Benjamin Zhan’s supervision. We would like to thank Dr. Guixing Wei (Senior Research Scientist at Brown University) for his input on method and analysis, and Mr. David Mills (Ph.D. Student) from Geography, Texas State University for his input on writing–reviewing, and editing some parts of the paper. The authors wish to thank the Texas Department of State Health Services (DSHS) and the Texas Cancer Registry (TCR) for providing the data used in the research. The contents are solely the responsibility of the authors and do not necessarily represent the official views of the Texas DSHS and the TCR. The authors do not endorse the purchase of any commercial products or services mentioned in the article.
- Ness KK, Armstrong GT, Kundu M, Wilson CL, Tchkonia T, Kirkland JL. Frailty in childhood cancer survivors. Cancer. 2015 May 15;121(10):1540-7. doi: 10.1002/cncr.29211. Epub 2014 Dec 19. PMID: 25529481; PMCID: PMC4424063.
- Siegel RL, Miller KD, Wagle NS, Jemal A. Cancer statistics, 2023. CA Cancer J Clin. 2023 Jan;73(1):17-48. doi: 10.3322/caac.21763. PMID: 36633525.
- Howlader N, Noone A, Krapcho M, Miller D, Bishop K, Kosary C. Cancer Statistics Review, 1975-2014 - SEER Statistics, National Cancer Institute [Internet]. SEER Cancer Statistics Review, 1975-2014. 2016. https://seer.cancer.gov/csr/1975_2015/
- Kaatsch P. Epidemiology of childhood cancer. Cancer Treat Rev. 2010 Jun;36(4):277-85. doi: 10.1016/j.ctrv.2010.02.003. Epub 2010 Mar 15. PMID: 20231056.
- Steliarova-Foucher E, Stiller C, Lacour B, Kaatsch P. International Classification of Childhood Cancer, third edition. Cancer. 2005 Apr 1;103(7):1457-67. doi: 10.1002/cncr.20910. PMID: 15712273.
- Fluchel MN, Kirchhoff AC, Bodson J, Sweeney C, Edwards SL, Ding Q, Stoddard GJ, Kinney AY. Geography and the burden of care in pediatric cancers. Pediatr Blood Cancer. 2014 Nov;61(11):1918-24. doi: 10.1002/pbc.25170. Epub 2014 Aug 17. PMID: 25131518; PMCID: PMC4749153.
- Lund MJ, Eliason MT, Haight AE, Ward KC, Young JL, Pentz RD. Racial/ethnic diversity in children's oncology clinical trials: ten years later. Cancer. 2009 Aug 15;115(16):3808-16. doi: 10.1002/cncr.24437. PMID: 19484783.
- Children’s Oncology Group (COG) [Internet]. COG Institution Locations: The world’s childhood cancer experts. Monrovia, CA; 2021 [cited 2021 Jan 1]. https://childrensoncologygroup.org/locations/
- Bhatia S, Sather HN, Heerema NA, Trigg ME, Gaynon PS, Robison LL. Racial and ethnic differences in survival of children with acute lymphoblastic leukemia. Blood. 2002 Sep 15;100(6):1957-64. doi: 10.1182/blood-2002-02-0395. PMID: 12200352.
- Kadan-Lottick NS, Ness KK, Bhatia S, Gurney JG. Survival variability by race and ethnicity in childhood acute lymphoblastic leukemia. JAMA. 2003 Oct 15;290(15):2008-14. doi: 10.1001/jama.290.15.2008. PMID: 14559954.
- Linabery AM, Ross JA. Childhood and adolescent cancer survival in the US by race and ethnicity for the diagnostic period 1975-1999. Cancer. 2008 Nov 1;113(9):2575-96. doi: 10.1002/cncr.23866. PMID: 18837040; PMCID: PMC2765225.
- Hamilton EC, Nguyen HT, Chang YC, Eberth JM, Cormier J, Elting LS, Austin MT. Health Disparities Influence Childhood Melanoma Stage at Diagnosis and Outcome. J Pediatr. 2016 Aug;175:182-7. doi: 10.1016/j.jpeds.2016.04.068. Epub 2016 May 24. PMID: 27233520.
- Morshed N, Zhan FB. Racial/ethnic, social characteristics and geographic disparities of childhood cancer late-stage diagnosis in Texas, 2005 to 2014. Ann GIS. 2021; 27(4):329–40. https://doi.org/10.1080/19475683.2021.1981999
- Luo W, Qi Y. An enhanced two-step floating catchment area (E2SFCA) method for measuring spatial accessibility to primary care physicians. Health Place. 2009 Dec;15(4):1100-7. doi: 10.1016/j.healthplace.2009.06.002. Epub 2009 Jun 18. Erratum in: Health Place. 2011 Jan;17(1):394. PMID: 19576837.
- Pearl J. Causality: Models, reasoning, and inference, second edition. Causality: Models, Reasoning, and Inference, Second Edition. New York, NY, USA: Cambridge University Press; 2011.
- Tchetgen Tchetgen EJ. Inverse odds ratio-weighted estimation for causal mediation analysis. Stat Med. 2013 Nov 20;32(26):4567-80. doi: 10.1002/sim.5864. Epub 2013 Jun 7. PMID: 23744517; PMCID: PMC3954805.
- Lange T, Vansteelandt S, Bekaert M. A simple unified approach for estimating natural direct and indirect effects. Am J Epidemiol. 2012 Aug 1;176(3):190-5. doi: 10.1093/aje/kwr525. Epub 2012 Jul 10. PMID: 22781427.
- Robins JM, Greenland S. Identifiability and exchangeability for direct and indirect effects. Epidemiology. 1992 Mar;3(2):143-55. doi: 10.1097/00001648-199203000-00013. PMID: 1576220.
- Pearl J. Direct and indirect effects. In: Proceedings of the American Statistical Association Joint Statistical Meetings [Internet]. Brentwood, MO: MIRA Digital Publishing; 2005; 1572–81. http://dl.acm.org/citation.cfm?id=2074073
- Vanderweele TJ, Vansteelandt S. Odds ratios for mediation analysis for a dichotomous outcome. Am J Epidemiol. 2010 Dec 15;172(12):1339-48. doi: 10.1093/aje/kwq332. Epub 2010 Oct 29. PMID: 21036955; PMCID: PMC2998205.
- VanderWeele TJ. Causal mediation analysis with survival data. Epidemiology. 2011 Jul;22(4):582-5. doi: 10.1097/EDE.0b013e31821db37e. PMID: 21642779; PMCID: PMC3109321.
- Rochon J, du Bois A, Lange T. Mediation analysis of the relationship between institutional research activity and patient survival. BMC Med Res Methodol. 2014 Jan 22;14:9. doi: 10.1186/1471-2288-14-9. PMID: 24447677; PMCID: PMC3917547.
- Kaplan EL, Meier P. Nonparametric Estimation from Incomplete Observations. Am Stat Assoc [Internet]. 1958;53(282):457–81. http://www.jstor.org/stable/2281868
- R Core Team. R: A language and environment for statistical computing (Version 3.2.4) [Software] [Internet]. R Foundation for Statistical Computing, Vienna, Austria; 2018. https://cran.r-project.org/bin/windows/base/old/3.2.4/
- Therneau TM, Lumley T. Survival Analysis: A package for survival analysis in R. 2018. https://github.com/therneau/survival
- Højsgaard S, Halekoh U, Yan J. The R Package geepack for Generalized Estimating Equations. J Stat Softw [Internet]. 2006;15(2):1–11. https://cran.r-project.org/web/packages/geepack/geepack.pdf%0Ahttp://www.jstatsoft.org/v15/i02/
- Harrell FE. Regression Modeling Strategies: Package “rms” [Internet]. 2018. http://biostat.mc.vanderbilt.edu/rms
- ICCC. International Classification of Childhood Cancer (ICCC): National Cancer Institute, SEER Cancer Statistics Review 1975-2011. 2011;103(7):34. https://seer.cancer.gov/archive/csr/1975_2011/results_merged/topic_icccrecode.pdf
- US Department of Health and Human Services. Secretary’s Advisory Committee on Health Promotion and Disease Prevention Objectives for 2030. [Internet]. Healthy People 2030 - Building a healthier future for all. 2022. Available from: https://www.cdc.gov/nchs/healthy_people/hp2030/hp2030.htm
- Bhatia S. Disparities in cancer outcomes: lessons learned from children with cancer. Pediatr Blood Cancer. 2011 Jun;56(6):994-1002. doi: 10.1002/pbc.23078. Epub 2011 Feb 15. PMID: 21328525; PMCID: PMC3369622.
- Gupta S, Wilejto M, Pole JD, Guttmann A, Sung L. Low socioeconomic status is associated with worse survival in children with cancer: a systematic review. PLoS One. 2014 Feb 26;9(2):e89482. doi: 10.1371/journal.pone.0089482. PMID: 24586813; PMCID: PMC3935876.
- Holmes L, Vandenberg J, McClarin L, Dabney K. Epidemiologic, Racial and Healthographic Mapping of Delaware Pediatric Cancer: 2004-2014. Int J Environ Res Public Health. 2015 Dec 22;13(1):ijerph13010049. doi: 10.3390/ijerph13010049. PMID: 26703649; PMCID: PMC4730440.
- Dang-Tan T, Trottier H, Mery LS, Morrison HI, Barr RD, Greenberg ML, Franco EL. Determinants of delays in treatment initiation in children and adolescents diagnosed with leukemia or lymphoma in Canada. Int J Cancer. 2010 Apr 15;126(8):1936-1943. doi: 10.1002/ijc.24906. PMID: 19795458.
- Martin S, Ulrich C, Munsell M, Taylor S, Lange G, Bleyer A. Delays in cancer diagnosis in underinsured young adults and older adolescents. Oncologist. 2007 Jul;12(7):816-24. doi: 10.1634/theoncologist.12-7-816. PMID: 17673613.
- Marquant F, Goujon S, Faure L, Guissou S, Orsi L, Hémon D, Lacour B, Clavel J. Risk of Childhood Cancer and Socio-economic Disparities: Results of the French Nationwide Study Geocap 2002-2010. Paediatr Perinat Epidemiol. 2016 Nov;30(6):612-622. doi: 10.1111/ppe.12313. Epub 2016 Aug 24. PMID: 27555468.
- Sedgwick P. How to read a Kaplan-Meier survival plot. BMJ. 2014 Sep 12;349:g5608. doi: 10.1136/bmj.g5608. PMID: 25216915.