
More Information
Submitted: July 10, 2023 | Approved: July 26, 2023 | Published: July 27, 2023
How to cite this article: Shukla M, Bansal S. Environmental PM2.5, Physical Activity Levels, and Aerobic Capacity, of Smokers and Non-Smokers. J Community Med Health Solut. 2023; 4: 057-062.
DOI: 10.29328/journal.jcmhs.1001036
Copyright License: © 2023 Shukla M, et al. This is an open access article distributed under the Creative Commons Attribution License, which permits unrestricted use, distribution, and reproduction in any medium, provided the original work is properly cited.
Keywords: Environmental PM2.5; VO2; Urban atmosphere; Fitness; Physical activity

Environmental PM2.5, Physical Activity Levels, and Aerobic Capacity, of Smokers and Non-Smokers
Mayank Shukla* and Sakshi Bansal
Department of Physiotherapy, SAHS, Sharda University, India
*Address for Correspondence: Mayank Shukla, Department of Physiotherapy, SAHS, Sharda University, India, Email: [email protected]
Aerobic capacity of young men (19 years - 24 years) is high, but can be influenced by many factors like physical activity, smoking, and air pollution with environmental PM2.5.
Objectives: (a) - to estimate the aerobic capacity in young men (smokers and non-smokers) living in areas with higher PM2.5 using Queen’s College Step Test (QCT). (b) - to find whether aerobic capacity is associated with the International Physical Activity Questionnaire (IPAQ)’ three classes, for smokers and non-smokers.
Methods: In a cross-sectional study using criteria-based sampling a total of n = 60 smokers & non-smokers were included from the Delhi NCR region. IPAQ, Peak Expiratory Flow Rate (PEFR), Heart Rate, Systolic Blood Pressure, Diastolic Blood Pressure, and PM2.5 and PM10 levels were recorded. A comparison of smokers and non-smokers was performed using z test. Smokers and non-smokers were divided into three classes using physical activity levels and compared for aerobic capacity. The correlation of aerobic capacity with variables was seen using Pearson’s correlation coefficient. Multiple R was checked to study the model of cause and effect for aerobic capacity.
Results: Significant difference is seen between smokers and non-smokers in the aerobic capacity (Mean ± SD smokers - 65.22 ± 8.73 ml/kg/min; Mean ± SD non-smokers 60.04 ± 7.7 ml/kg/min p value = 0.00). For non-smokers, a low level of physical activity shows a strong correlation with aerobic capacity (r = 0.78; p = < 0.05). No correlation of aerobic capacity is seen with physical activity levels among smokers. Aerobic capacity shows a significant negative and moderate correlation with PM2.5 (r = -3.1; p = 0.016). The multiple R coefficient value for the model of cause and effect is 6.99 with a p - value of 0.0449 for this.
Conclusion: Smoking affects aerobic capacity significantly for young men. High and moderate levels of outdoor physical activity do not increase aerobic capacity in areas with high PM2.5, whereas low levels show a positive correlation among non-smokers only.
Aerobic capacity is a hallmark of health. Smoking is a major threat to the health of young men, which approximately kills 8 million people in a year as per the World Health Organization (WHO). The number of deaths due to smoking-related diseases will reach more than 8.3 million by 2030 [1]. Approximately 80% of deaths due to smoking will occur in developing countries [2]. Smokers who are involved in moderate to high levels of regular physical activity show a lesser decline in their lung function and a lower risk of Chronic Obstructive Pulmonary Disease (COPD). There is an inverse association between smoking and physical activity, for fitness. Therefore, it is believed that if someone does regular fitness exercises to maintain his health he can counter the negative effects of smoking. It is because the inflammatory markers which are produced in our body by smoking can be suppressed if there is cardio-respiratory fitness because of physical activity [3].
Residents of areas with high air pollution may get exposed to high levels of pollutants during outdoor physical activity as seen in Figure 1. Delhi Near the Capital Region (NCR) is notoriously polluted with particulate matter - PM2.5 levels and PM10 levels [4]. This has been there for a few years despite many reports and guidelines [5]. Urban citizens’ smokers and non-smokers, usually involve in outdoor physical activity like walking or exercise as health measures. Outdoor environments can be a park or roadside pedestrian pavement. Outdoor physical activity is regarded as a means to increase aerobic capacity and may give benefits to smokers as well as non-smokers. People working outdoors or playing in the open are exposed to high levels of these pollutants [6] as seen in Figure 1. It is reported to have adverse effects on cognition and brain [7,8]. What are the ill effects of air pollution on aerobic capacity in smokers or non-smokers has not been reported or explored? It is expected that physical activity shall be a determinant of aerobic capacity, along with this age, resting heart rate, smoking, and obesity are also prominent factors for aerobic capacity. Anthropometric measures like Body Mass Index (BMI), waist circumference, and neck circumference may also affect the aerobic capacity and are confounders for this [9,10] and were checked (Table 1).
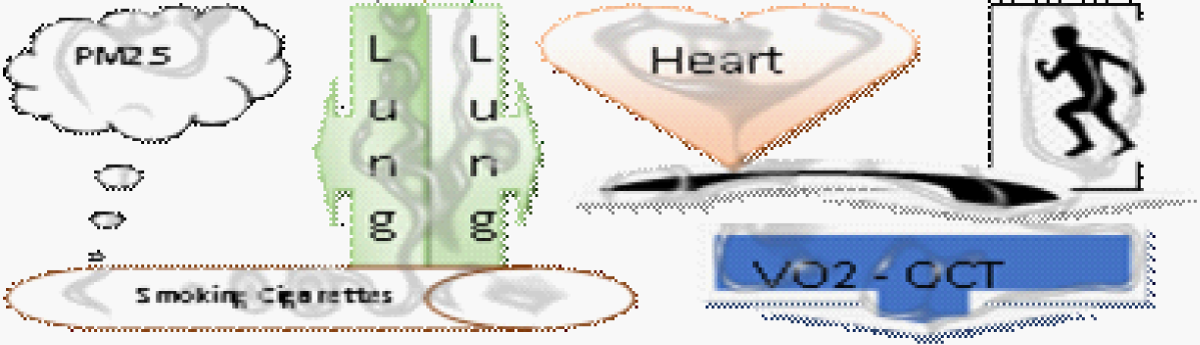
Figure 1: Aerobic capacity (QCT) in Delhi NCR and environmental, and lifestyle factors.
| Table 1: Demographic details of smokers (n = 30) and non-smokers (n = 30) in Delhi NCR regions. | ||
| Demographic details Mean ± SD of participants. | ||
| Non- smokers(n = 30) | Smokers (n = 30) | |
| AGE(years) | 21.4 ± 2.47 | 22 ± 1.92 |
| BMI(kg/m2) | 21.8 ± 2.22 | 22.9 ± 1.64 |
| WC(inch) | 32.3 ± 2.36 | 32.9 ± 2.31 |
| NC(inch) | 14.11 ± 1.17 | 14.9 ± 1 |
| VO2 peak ml/min | 60.04 ± 8.2 | 65.22 ± 6.3 |
| PEFR L/min | 4491 ± 3792.5 | 2553 ± 2838.5 |
| IPAQ MET/week | 409.3 ± 103.2 | 399.3 ± 99.4 |
| BMI = Body Mass Index; WC = Waist Circumference; NC = Neck Circumference; VO2 peak = Queens’s College Step Test (QCT) Derived aerobic capacity; PEFR= Peak Expiratory Flow Rate; IPAQ= International Physical Activity Questionnaire. | ||
Ambient air pollution - particulate matter has levels as per size –PM10, PM2.5, and ultra-fine particulate matter, but now it has a focus on PM2.5, which is very smaller particles less than 2.5 microns that can go into the alveoli and may stay there get into the blood as well [11]. It is invisible to the naked eye. Burning garbage, stubble burning, kutcha road, and construction activity are some of the causes of the increase in the concentration of PM2.5 in Delhi near the capital region (NCR) [12]. The smoking and non-smoking population both are exposed to air pollution.
The purpose of the study was to explore the effects of PM2.5 and physical activity, and the effects of smoking on aerobic capacity, or whether there is a difference in the aerobic capacity of the two is yet another aspect we have explored. The study was carried out using a sample from Delhi NCR, and the results are explained using tables in the following sections.
Study design
Cross-sectional study design a sample of 60 young adults of age between 18 - 27 years was collected from the University population living in Delhi NCR, during April-May 2019 as seen in the flow chart of Figure 2.
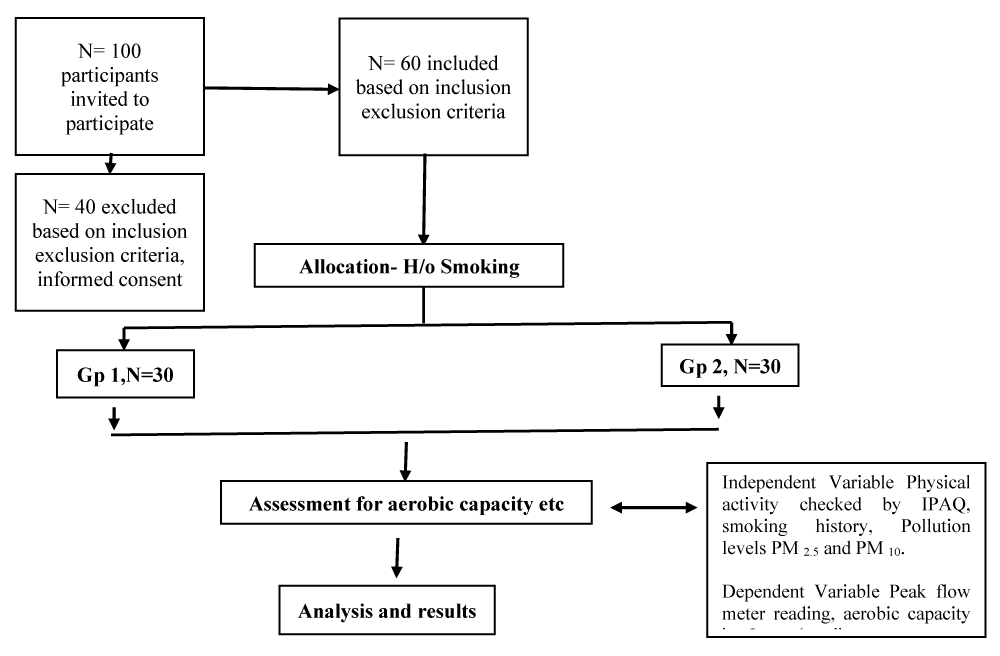
Figure 2: Study flow chart – showing population and sample as per the inclusion and exclusion criteria, allocation based on the smoking history. The variables physical activity checked by international physical activity questionnaire (IPAQ), aerobic capacity checked by Queen’s college step test, and PM2.5 and PM10 levels from pollution control board website data.
Sampling method: Criteria-based sampling.
Sample size
A sample of 60 participants including 30 Smokers - smoking at least 5 cigarettes per day for at least 2 years, and 30 non-smokers who have never smoked and living in areas with higher PM2.5. The calculation of sample size was based on smoking proportions in the general population. 0.775 was taken as the unexposed proportion for a z-test. With continuity correction total sample size came out to be 57.
Selection Criteria:
a) Inclusion criteria:
• Males
• 18-27 years of age
• Normal BMI (18.5 - 24.9).
b) Exclusion criteria:
• Asthma
• Coronary artery disease
• Chronic obstructive pulmonary disease (COPD)
• Hypertension
• Leg injuries in the past few days or one month
• Inability to perform Queen’s college step test.
Independent Variable: Physical activity checked by IPAQ, smoking history, Pollution levels PM2.5 and PM10.
Dependent variable: Peak flow meter reading, aerobic capacity by Queen’s College test.
Instruments required:
• Consent form,
• Data collection sheet,
• General Assessment Performa,
• A stool of 16.25 inches’ height,
• Peak flow meter,
• Metronome,
• Stop watch,
• Sphygmomanometer,
• Inch tape,
• International Physical Activity Questionnaire- short form
Group allocation: n = 100 young men were invited to participate. n = 60 participants were included and divided into 2 groups (30 in each) as per smoking history (smokers and non-smokers) - living in areas with higher PM2.5. This is seen in the flow chart in Figure 2.
Procedure: all the participants who met the inclusion criteria and consented to participate in the study were provided with written informed consent prior to the study. Those participants n = 40 who did not meet the criteria disagreed to fill out the consent form were excluded from the study. Ethical approval was granted by the AIPT, AUUP institutional committee for NTCCs.
All the participants were explained about the procedure and the purpose of the study. Written informed consent was taken. Before taking the reading they were demonstrated every test they were required to undergo.
The level of physical activity of both smokers and non-smokers was determined by the international physical activity questionnaire (IPAQ) [13] - short form, in which the total energy expenditure was calculated in terms of metabolic equivalent task-minutes per week and time spent in those physical activities. Participants were asked to note the time they spend in various physical activities in a typical week and were then asked to answer the questions in the questionnaire even if they didn’t consider themselves to be a physically active person. They were asked about the time they spend in various activities like aerobic exercise, heavy lifting, cycling, running, light weight lifting, etc. In answering the questions, the participants were explained before attempting the questionnaire that ‘vigorous-intensity activity’ are the activities that require hard physical effort and causes a large increase in breathing or heart rate, ‘moderate-intensity activity’ are activities that require moderate physical effort and cause small increases in breathing or heart rate and then about the walking for 10 minutes at a time in a day.
After filling out the questionnaire, the participants were assessed for their neck circumference and waist circumference. Following this, the peak expiratory flow rate was observed using a peak flow meter with the following procedure, first of all, before the initial use, the reading was kept at zero. After that the subjects were asked to take a deep breath and the mouthpiece of the peak flow meter was put into the subject’s mouth. The lips were asked to keep tight around the mouthpiece. In one breath the hardest blow was asked to do rapidly. Three readings were taken and the maximum readings with this procedure were marked as the highest reading.
For the aerobic capacity, QCT – a valid step-up test was administered [14], where the participants were first described the test and its procedure was such that participants were asked to sit on a chair and relax, after that their resting heart rate was first calculated by carotid pulse for 15 seconds and then was multiplied by 4 to calculate beats per minute. Blood Pressure was checked using a dial sphygmomanometer. After that, they were asked to step on and off the stool for 3 minutes at the beats of a metronome at a rate of 24 steps up per minute. Stopwatch was started when the subjects started the test and immediately stopped after a period of 3 minutes. After completion of the test, they were seated down and carotid pulse rate was assessed from the fifth to the twentieth second of the recovery period for 15 seconds and was again converted to beats/min, and BP was measured. After this 1-minute rest was given to participants and again their heart rate and BP were measured and noted down.
A regular noting of the air quality index was ensured on the days whenever data was collected from a universal site regarding the air pollution in Delhi NCR (https://aqicn.org/city/india/up/noida/sector-125/) [4].
Data analysis
Statistical analysis of the data included descriptive quantitative statistics and was seen in terms of mean and standard deviation of age, BMI, waist circumference and neck circumference, PM2.5 & PM10 levels. For inferential analysis, Pearson’s correlation coefficient was used to determine the association between physical activity and aerobic capacity. R - value was calculated for different variables. T-test was used for comparison of aerobic capacity in smokers and non-smokers. A regression analysis was done for aerobic capacity and the effect with other variables including PM2.5 and PM10. Multiple R – which checks the strength of linear regression and is the coefficient of multiple correlations checking aerobic capacity as a dependent variable and all others as the independent variable. A p-value of 0.05 was used as the level of significance.
The results are summarized in the following tables, Table 1 is having descriptive data, and Table 2 is inferential data of aerobic capacity between smokers and non-smokers. Tables 3,4 are comparing the physical activity levels for their association with aerobic capacity for smokers and non-smokers respectively. Tables 5,6 are showing the association of aerobic capacity as regression and correlation coefficients.
| Table 2: Z Test between QCT-derived aerobic capacity of smokers and non-smokers. | ||||
| Group | Mean ± SD | Z-score critical one tail | p value 1 tailed | p value 2 tailed |
| Non Smokers | 65.22 ± 8.23 | 1.64 | 0.00 | 0.006** |
| Smokers | 60.04 ± 7.70 | |||
| Shows a significant difference between the QCT-derived aerobic capacity of smokers and non-smokers as analyzed using the z-test. (Z = 2.5, 2-tailed). | ||||
| Table 3: Association of aerobic capacity and physical activity in smokers. | ||||
| IPAQ level | Mean | VO2 Peak | R - value | p value < 0.05 |
| High PA | 5612 ± 2490.3 | 60.93 ± 7.57 | 0.09 | 0.78 |
| Moderate PA | 1221.05 ± 722.44 | 58.45 ± 8.87 | 0.13 | 0.70 |
| Low PA | 374 ± 246.5 | 62.33 ± 3.45 | -0.1 | 0.75 |
| Shows the association of the various levels of physical activity according to the IPAQ with the aerobic capacity of smokers. The r value for high, moderate, and low PA is not correlated with the aerobic capacity in smokers. | ||||
| Table 4: Association of aerobic capacity and physical activity in non-smokers. | ||||
| IPAQ level | Mean | VO2 peak | R - value | p value < 0.05 |
| High PA | 6628.8 ± 3130 | 63.15 ± 9.19 | 0.21 | 0.38 |
| Moderate PA | 1419.8 ± 654.9 | 62.8 ± 8.55 | -0.22 | 0.77 |
| Low PA | 443.3 ± 85.7 | 67.95 ± 5.67 | 0.78 | 0.037* |
| Shows the association of the various levels of physical activity according to the IPAQ with the aerobic capacity of non-smokers. The r value for high PA is weakly correlated with aerobic capacity; moderate PA was negatively correlated with aerobic capacity and low PA was strongly correlated with the aerobic capacity in smokers. | ||||
| Table 5: Regression coefficient [Multiple R] of PM2.5 & PM10 with aerobic capacity. | ||||
| Pollutant | Mean ± sd | Variance | Multiple R - value | p value |
| PM2.5 | 155.6 ± 43.08 | 1825 | 6.99 | .04* |
| PM10 | 127.3 ± 41.89 | 1755.3 | 5.96 | .07 |
| Shows multiple R - regression coefficient among the air quality index and aerobic capacity. The PM2.5 particles are significantly (p < 0.05), associated with aerobic capacity, whereas the PM10 particles also showed a non-significant association with aerobic capacity irrespective of smoking habit. | ||||
| Table 6: Pearson's correlation coefficient of aerobic capacity (QCT) with other variables when all 60 participants are considered. | |||
| Variable 1 | Variable 2 | Pearson correlation coefficient | p - value |
| QCT | AGE | .141 | .283 |
| QCT | WEIGHT | .7 | .446 |
| QCT | BMI | .079 | .547 |
| QCT | HEIGHT | .108 | .413 |
| QCT | RHR | .082 | .536 |
| QCT | IHR | .229 | .078 |
| QCT | RPP | .058 | .660 |
| QCT | DBP | .184 | .160 |
| QCT | SBP | .012 | .929 |
| QCT | IPAQ | -.214 | .100 |
| QCT | PM2.5 | -.31 | .016* |
| QCT | PM10 | -.16 | .223 |
| QCT | PEFR | -.137 | 2.96 |
| Shows the correlation coefficients of various variables with QCT and their corresponding p-value. Significant p = 0.16 and moderately negative r = ─.31 correlation is seen with PM2.5 only. All other Pearson’s correlation coefficients are non-significant and weak. (BMI-body mass index, RHR-resting heart rate, IHR- heart rate after 1 min of test, RPP –rate pressure product, DBP- diastolic blood pressure, SBP- systolic blood pressure, IPAQ-International physical activity questionnaire, PM2.5- particulate matter smaller than 2.5 microns, PM10 is particulate matter smaller than 10 microns, PEFR-peak expiratory flow rate). | |||
IPAQ, PEFR, and VO2 values for smokers and non-smokers are seen in Table 1, there is a significant difference in the aerobic capacity for smokers and non-smokers as expected (Table 2).
Nicotine in cigarette smoke has many adverse effects on health and a decrease in aerobic capacity is the result of them. There are many variables that explain the aerobic capacity [9,10,15,16] other than smoking. The variables considered by the present study have given significant Multiple R as seen in Table 6, thus explaining the QCT-derived aerobic capacity variation for the participants - young men, urban population (n = 60) seen in Table 3. Delhi NCR’s air quality index of PM2.5 ranged from 85 to 263 and had a mean of 155.6 with an SD of 43; PM10 ranged from 78 to 213 and had a mean of 127 with an SD of 41, during the data collection days as checked from air quality index site [4]. Aerobic capacity is dependent upon cardiac output (HR x SV) and the extraction of oxygen from arterial blood by working muscles according to Fick’s equation - VO2 = CO x CaO2-CvO2 {Fick’s equation} [17-19]. The advent of PM2.5 and PM10 levels in the already polluted environment at very high levels can lead to a situation whereby some unexplored mechanisms of PM2.5 not only decrease the aerobic capacity levels but increase morbidity and mortality. These effects may vary in smokers and non-smokers who exercise or are sedentary [19-22,23].
Smoking decreases aerobic capacity as seen in the mean values and z-test of QCT-derived aerobic capacity in Tables 2,3. QCT is significantly different between smokers and non-smokers. However, when grouped according to physical activity levels the smokers have shown no correlation between QCT-derived aerobic capacity with physical activity (Table 4); a strong and significant correlation is seen between low physical activity and QCT-derived aerobic capacity among non-smokers (Table 5). Why it is opposite to expectations?
Leisure time physical activity has been reported not to affect the aerobic capacity in the elderly [15], it influences their metabolic function, and however, the multi-collinearity exists between the number of variables. In the present study only in the non-smoking group, there is a statistically significant (p < 0.05) correlation between low levels of physical activity and aerobic capacity. In the case of smokers, there is no correlation (Tables 4,5). In regression analysis of multiple R, the IPAQ has a coefficient of 2 which states there is an increase of two factors when physical activity is increased by 1 factor, but it has a non-significant p - value (0.458). Thus, in the present model and urban population of Delhi, NCR physical activity is not a significant factor for aerobic capacity, and limiting physical activities on polluted days may strongly influence the aerobic capacity positively (r =0.78) as seen in Table 4.
The green environment has been reported to be more beneficial for physical health as compared to the urban environment. What all factors produce such change is largely unexplored, indoor plantation may be the future [24-26].
The concentration of PM2.5- (PM2.5-C) in the form of ambient pollution or a dust storm has been reported to cause inflammation and DNA damage [27] and is associated with a decline in aerobic capacity. Mechanisms of decline in aerobic capacity- There is temporal variation in the PM2.5 –C where features like construction activity, fire from farm burning, or industrial areas can spike its levels [28]. Various mechanisms like thrombotic activation, oxidative damage, and increased inflammation have been cited as few known possible mechanisms for the deterioration of vascular patency with increasing PM2.5 -C. Due to a decrease in heart rate variability caused by the PM2.5 levels adverse effect on the heart, and changes in endothelial function the cardiac out may get affected. The function of red blood cells is also disturbed and it produces a decrease in the oxygen-carrying capacity of the blood [29-32]. These changes may be analyzed specifically in different studies for specific locations and are not covered in the present study which is a limitation.
Ambient air-pollution mainly a concentration of PM2.5 (PM2.5 -C) has been recognized as a modifiable risk factor for coronary artery disease [33], in the present study disease-specific populations were not studied. Also, restrictions on physical activity due to ambient air pollution are a secondary complication of poor air quality, thus remaining indoors may be the new advice. - It is a startling paradigm shift of age-old health beliefs. Pulmonary variables like FEV1 and FVC may have produced a change in the studied population in aerobic capacity and were not checked in the present study which is a limitation. Only young men are included, and women are not tested this is a limitation.
However, the next question is if outdoor physical activity is considered harmful now, what are the options as everything can’t be indoors- however outdoor physical activity can be modified with the usage of masks and also there are reports of variation in PM2.5 levels [28] and it is reported by the national database as seen in Delhi. https://aqicn.org/city/delhi/), specific masks with a PM2.5 filter and tested for this are believed to be helpful [34]. Many individuals suffer from respiratory illness, such populations should be advised about the health hazards of air pollution while involved in exercises and physical activities and they must adapt to it by using preventive measures such as avoiding excessive outdoor physical activity, using a specific filter /mask to avoid direct exposure with the pollutants during outdoor physical activity.
Smoking significantly impairs aerobic capacity, high level of outdoor physical activity is recommended in clean air, low level of physical activity is advised in areas with high PM2.5 levels. Outdoor physical activity guidelines may include mask usage and checking air pollution levels.
Additional information and declarations
Funding
Grant Disclosures: There was no grant funder for this study.
- World Health Organization. News Room. Facts-sheets, details, tobacco. https://www.who.int/news-room/fact-sheets/detail/tobacco accessed on 19.11.2019
- Lim HK, Ghazali SM, Kee CC, Lim KK, Chan YY, Teh HC, Yusoff AF, Kaur G, Zain ZM, Mohamad MH, Salleh S. Epidemiology of smoking among Malaysian adult males: prevalence and associated factors. BMC Public Health. 2013 Jan 7;13:8. doi: 10.1186/1471-2458-13-8. PMID: 23294728; PMCID: PMC3549287.
- Barboza ML, Barbosa AC, Spina GD, Sperandio EF, Arantes RL, Gagliardi AR, Romiti M, Dourado VZ. Association between physical activity in daily life and pulmonary function in adult smokers. J Bras Pneumol. 2016 Apr;42(2):130-5. doi: 10.1590/S1806-37562015000000102. PMID: 27167434; PMCID: PMC4853066.
- Delhi Air Pollution. Real-time air quality index. https://aqicn.org/city/delhi/ downloaded on 15.11.2019. (The Data sources used for the Air Quality, Air Pollution, PM2.5 (fine particulate matter), PM10 (respirable particulate matter), NO2 (nitrogen dioxide), SO2 (sulfur dioxide), CO (carbon monoxide), O3 (ozone) and Weather data in this page are coming from: Citizen Weather Observer Program (CWOP/APRS), IMD - India Meteorological Department, CPCB - India Central Pollution Control Board, Delhi Pollution Control Committee (Government of NCT of Delhi)
- Goyal P, Gulia S, Goyal SK, Kumar R. Assessment of the effectiveness of policy interventions for Air Quality Control Regions in Delhi city. Environ Sci Pollut Res Int. 2019 Oct;26(30):30967-30979. doi: 10.1007/s11356-019-06236-1. Epub 2019 Aug 26. PMID: 31452124.
- Li F, Liu Y, Lü J, Liang L, Harmer P. Ambient air pollution in China poses a multifaceted health threat to outdoor physical activity. J Epidemiol Community Health. 2015 Mar;69(3):201-4. doi: 10.1136/jech-2014-203892. Epub 2014 Jun 26. PMID: 24970766; PMCID: PMC4514977.
- Bos I, De Boever P, Int Panis L, Meeusen R. Physical activity, air pollution and the brain. Sports Med. 2014 Nov;44(11):1505-18. doi: 10.1007/s40279-014-0222-6. PMID: 25119155.
- Lin H, Guo Y, Di Q, Zheng Y, Kowal P, Xiao J, Liu T, Li X, Zeng W, Howard SW, Nelson EJ, Qian Z, Ma W, Wu F. Ambient PM2.5 and Stroke: Effect Modifiers and Population Attributable Risk in Six Low- and Middle-Income Countries. Stroke. 2017 May;48(5):1191-1197. doi: 10.1161/STROKEAHA.116.015739. Epub 2017 Apr 6. PMID: 28386038; PMCID: PMC5535267.
- Laukkanen JA, Laaksonen D, Lakka TA, Savonen K, Rauramaa R, Mäkikallio T, Kurl S. Determinants of cardiorespiratory fitness in men aged 42 to 60 years with and without cardiovascular disease. Am J Cardiol. 2009 Jun 1;103(11):1598-604. doi: 10.1016/j.amjcard.2009.01.371. Epub 2009 Apr 22. PMID: 19463522.
- McGuire KA, Ross R. Incidental physical activity is positively associated with cardiorespiratory fitness. Med Sci Sports Exerc. 2011 Nov;43(11):2189-94. doi: 10.1249/MSS.0b013e31821e4ff2. Erratum in: Med Sci Sports Exerc. 2012 Mar;44(3):562. PMID: 21502894.
- Pope CA 3rd, Dockery DW. Health effects of fine particulate air pollution: lines that connect. J Air Waste Manag Assoc. 2006 Jun;56(6):709-42. doi: 10.1080/10473289.2006.10464485. PMID: 16805397.
- Venkataraman C, Brauer M, Tibrewal K, Sadavarte P, Ma Q, Cohen A, Chaliyakunnel S, Frostad J, Klimont Z, Martin RV, Millet DB, Philip S, Walker K, Wang S. Source influence on emission pathways and ambient PM2.5 pollution over India (2015-2050). Atmos Chem Phys. 2018 Jun;18(11):8017-8039. doi: 10.5194/acp-18-8017-2018. Epub 2018 Jun 7. PMID: 33679902; PMCID: PMC7935015.
- Lee PH, Macfarlane DJ, Lam TH, Stewart SM. Validity of the International Physical Activity Questionnaire Short Form (IPAQ-SF): a systematic review. Int J Behav Nutr Phys Act. 2011 Oct 21;8:115. doi: 10.1186/1479-5868-8-115. PMID: 22018588; PMCID: PMC3214824.
- Chatterjee S, Chatterjee P, Mukherjee PS, Bandyopadhyay A. Validity of Queen's College step test for use with young Indian men. Br J Sports Med. 2004 Jun;38(3):289-91. doi: 10.1136/bjsm.2002.002212. PMID: 15155428; PMCID: PMC1724834.
- Tager IB, Hollenberg M, Satariano WA. Association between self-reported leisure-time physical activity and measures of cardiorespiratory fitness in an elderly population. Am J Epidemiol. 1998 May 15;147(10):921-31. doi: 10.1093/oxfordjournals.aje.a009382. PMID: 9596470.
- Pedersen BK, Saltin B. Evidence for prescribing exercise as therapy in chronic disease. Scand J Med Sci Sports. 2006 Feb;16 Suppl 1:3-63. doi: 10.1111/j.1600-0838.2006.00520.x. PMID: 16451303.
- Rowland TW. Circulatory responses to exercise: are we misreading Fick? Chest. 2005 Mar;127(3):1023-30. doi: 10.1378/chest.127.3.1023. PMID: 15764789.
- Rowland T. Echocardiography and circulatory response to progressive endurance exercise. Sports Med. 2008;38(7):541-51. doi: 10.2165/00007256-200838070-00002. PMID: 18557657.
- Naeije R, Chesler N. Pulmonary circulation at exercise. Compr Physiol. 2012 Jan;2(1):711-41. doi: 10.1002/cphy.c100091. PMID: 23105961; PMCID: PMC3480234.
- Raven PB, Drinkwater BL, Ruhling RO, Bolduan N, Taguchi S, Gliner J, Horvath SM. Effect of carbon monoxide and peroxyacetyl nitrate on man's maximal aerobic capacity. J Appl Physiol. 1974 Mar;36(3):288-93. doi: 10.1152/jappl.1974.36.3.288. PMID: 4814294.
- Reid CE, Brauer M, Johnston FH, Jerrett M, Balmes JR, Elliott CT. Critical Review of Health Impacts of Wildfire Smoke Exposure. Environ Health Perspect. 2016 Sep;124(9):1334-43. doi: 10.1289/ehp.1409277. Epub 2016 Apr 15. PMID: 27082891; PMCID: PMC5010409.
- Lelieveld J, Haines A, Pozzer A. Age-dependent health risk from ambient air pollution: a modelling and data analysis of childhood mortality in middle-income and low-income countries. Lancet Planet Health. 2018 Jul;2(7):e292-e300. doi: 10.1016/S2542-5196(18)30147-5. PMID: 30074892.
- Lelieveld J, Klingmüller K, Pozzer A, Pöschl U, Fnais M, Daiber A, Münzel T. Cardiovascular disease burden from ambient air pollution in Europe reassessed using novel hazard ratio functions. Eur Heart J. 2019 May 21;40(20):1590-1596. doi: 10.1093/eurheartj/ehz135. PMID: 30860255; PMCID: PMC6528157.
- Bowler DE, Buyung-Ali LM, Knight TM, Pullin AS. A systematic review of evidence for the added benefits to health of exposure to natural environments. BMC Public Health. 2010 Aug 4;10:456. doi: 10.1186/1471-2458-10-456. PMID: 20684754; PMCID: PMC2924288.
- Thompson Coon J, Boddy K, Stein K, Whear R, Barton J, Depledge MH. Does participating in physical activity in outdoor natural environments have a greater effect on physical and mental wellbeing than physical activity indoors? A systematic review. Environ Sci Technol. 2011 Mar 1;45(5):1761-72. doi: 10.1021/es102947t. Epub 2011 Feb 3. PMID: 21291246.
- James P, Banay RF, Hart JE, Laden F. A Review of the Health Benefits of Greenness. Curr Epidemiol Rep. 2015 Jun;2(2):131-142. doi: 10.1007/s40471-015-0043-7. PMID: 26185745; PMCID: PMC4500194.
- Gualtieri M, Ovrevik J, Mollerup S, Asare N, Longhin E, Dahlman HJ, Camatini M, Holme JA. Airborne urban particles (Milan winter-PM2.5) cause mitotic arrest and cell death: Effects on DNA, mitochondria, AhR binding and spindle organization. Mutat Res. 2011 Aug 1;713(1-2):18-31. doi: 10.1016/j.mrfmmm.2011.05.011. Epub 2011 May 30. PMID: 21645525.
- Kulshrestha A, Satsangi PG, Masih J, Taneja A. Metal concentration of PM(2.5) and PM(10) particles and seasonal variations in urban and rural environment of Agra, India. Sci Total Environ. 2009 Dec 1;407(24):6196-204. doi: 10.1016/j.scitotenv.2009.08.050. Epub 2009 Sep 29. PMID: 19793609.
- Stone V, Miller MR, Clift MJD, Elder A, Mills NL, Møller P, Schins RPF, Vogel U, Kreyling WG, Alstrup Jensen K, Kuhlbusch TAJ, Schwarze PE, Hoet P, Pietroiusti A, De Vizcaya-Ruiz A, Baeza-Squiban A, Teixeira JP, Tran CL, Cassee FR. Nanomaterials Versus Ambient Ultrafine Particles: An Opportunity to Exchange Toxicology Knowledge. Environ Health Perspect. 2017 Oct 10;125(10):106002. doi: 10.1289/EHP424. PMID: 29017987; PMCID: PMC5933410.
- Huang YW, Cambre M, Lee HJ. The Toxicity of Nanoparticles Depends on Multiple Molecular and Physicochemical Mechanisms. Int J Mol Sci. 2017 Dec 13;18(12):2702. doi: 10.3390/ijms18122702. PMID: 29236059; PMCID: PMC5751303.
- Meldrum K, Guo C, Marczylo EL, Gant TW, Smith R, Leonard MO. Mechanistic insight into the impact of nanomaterials on asthma and allergic airway disease. Part Fibre Toxicol. 2017 Nov 21;14(1):45. doi: 10.1186/s12989-017-0228-y. PMID: 29157272; PMCID: PMC5697410.
- Garcia-Mouton C, Hidalgo A, Cruz A, Pérez-Gil J. The Lord of the Lungs: The essential role of pulmonary surfactant upon inhalation of nanoparticles. Eur J Pharm Biopharm. 2019 Nov; 144:230-243. doi: 10.1016/j.ejpb.2019.09.020. Epub 2019 Sep 24. PMID: 31560956.
- Wang C, Tu Y, Yu Z, Lu R. PM2.5 and Cardiovascular Diseases in the Elderly: An Overview. Int J Environ Res Public Health. 2015 Jul 16;12(7):8187-97. doi: 10.3390/ijerph120708187. PMID: 26193289; PMCID: PMC4515716.
- Xu J, Xiao X, Zhang W, Xu R, Kim SC, Cui Y, Howard TT, Wu E, Cui Y. Air-Filtering Masks for Respiratory Protection from PM2.5 and Pandemic Pathogens. One Earth. 2020 Nov 20;3(5):574-589. doi: 10.1016/j.oneear.2020.10.014. PMID: 33748744; PMCID: PMC7962856.